Interpretation
In this section, we interpret the physical property models recovered through inversion, in terms of geologic units. The basis of our interpretations comes from the physical properties table and the geologic cross-section. The cross-section is most appropriate for line N12200.
General
The animations for conductivity and chargeabilty were presented in the previous section and iso-surface images are provided in Fig. 456. We use the two iso-surface images for our “general” or “first-order” interpretation. Labels A through G have been added to the figures and these are explained below.
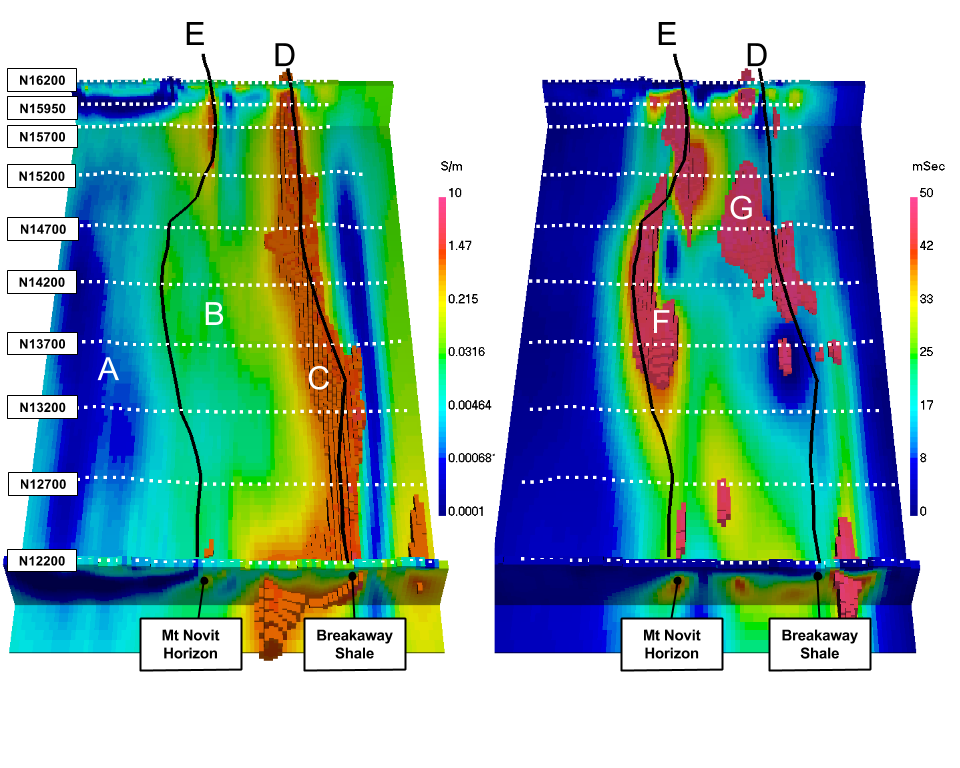
Fig. 456 Perspective view of the recovered 3D conductivity (left) and chargeability (right) models. Interpreted geological units (black) are shown for reference.
A: Surprise Creek Formation: A volcanic unit that is highly resistive and non-chargeable. It has a steeply dipping contact with the Moondarra Siltstones.
B: The predominant rocks in this region are the Moondarra and Native Bee siltstones. They cannot be distinguished on the basis of conductivity and chargeability. These rocks may contain an Eastern Creek Volcanics Quartzite unit that is resistive and non-chargeable and appears as a vertical contact between the Moondarra and Native Bee siltstones. We address this in more detail in the “enhanced” portion of this interpretation.
C: Breakaway Shales: This is a highly conductive unit that dominates the conductivity model. Conductivities in the inversion exceeded 10 S/m. The black line D, which denotes the horizontal location of the near surface portion of the unit, will be used in other images. We note that the shale unit does not appear to be chargeable. This is most evident in the plan-view section in Fig. 457 (right). The trace of the high conductivity is associated with chargeability lows.
E and F: Mt Novit Horizon: This is characterized by a zone of moderately high conductivity and high chargeability. The line E has been drawn to reflect that correlation and it corresponds to a similar trajectory presented in the initial paper by [ROS01]. The chargeability along this trajectory is not uniform. There is variation in amplitude and there are breakages.
G: Other regions of chargeability, and potentially mineralization, within the siltstone complex. Much of this seems to be “in-board” (west) of the Breakaway shale.
Enhanced
We continue with a finer resolution interpretation using horizontal sections at 125 m below topography (Fig. 457). The labels are the same as in the general section, but here the siltstones are divided into two subsections: B1 and B2. The easterly located Moondara Siltstone (B1) is separated from the Native Bee Siltstone (B2) by the resistive Eastern Creek volcanics. The sequence of “Moondarra siltstone - Eastern Creek Volcanics - Native Bee” is clear in the southern part of the inversion and consistent with the cross-section located at line N12200. In the north, the resistive volcanics between the siltstones disappears, while the chargeability low is continuous throughout the section. Using both physical properties enables the separation of the Moondarra and Native Bee rocks. The two sub-regions of B contain the highest target potential based on high chargeability within the moderate conductivity of the siltstones.
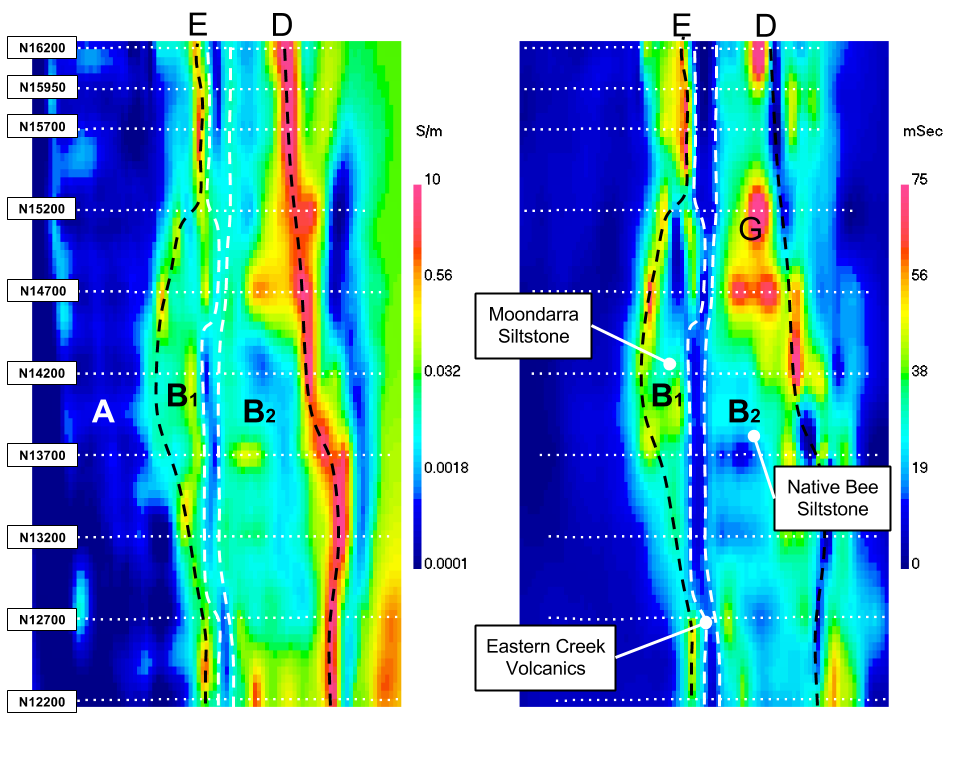
Fig. 457 : Sections through the recovered 3D conductivity (left) and chargeability (right) models. Interpreted geological units (black) are shown for reference.
Summary
In this section, inversion results are interpreted to bring the final recovered physical property models back into the realm of geology. Fig. 458 shows a cross-section view through both the recovered conductivity model (left) and chargeability model (right) along with the final interpretatation of the units. The units line up well with the geo-rectified geologic cross-section (Fig. 445) and allow a high-level of confidence of the interpretation to the north. The Breakaway shale unit has very large conductivities (higher than expected); the Novit Horizon appears as a low to moderate conductor. The Moondarra Siltsone breaks around line N14700, most likely due to faulting. The 3D inversion shows more detail than the 2D inversions and attempts to connect features from line to line. Yet, the results confirm the presence of a “2D” geology in general.
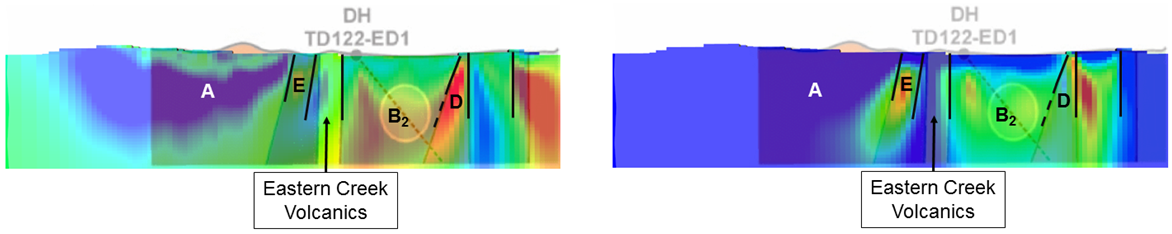
Fig. 458 Coincident cross-section through the conductivity (left) and chargeability (right) models with the interpreted units and super-imposed. The units line up well with the geo-rectified geologic cross-section.