Survey
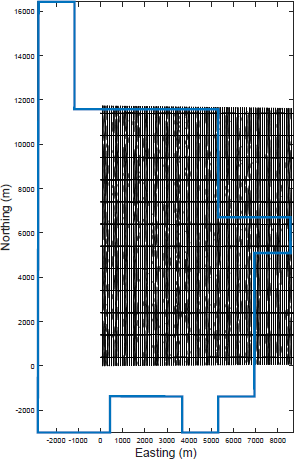
Fig. 293 The VTEM survey contained 86 flight lines and 12 tie lines for a total of 428,340 data locations over a survey area of approximately 100 square km in the Athabasca oil sands. The blue line indicates the boundary of the Aspen property.
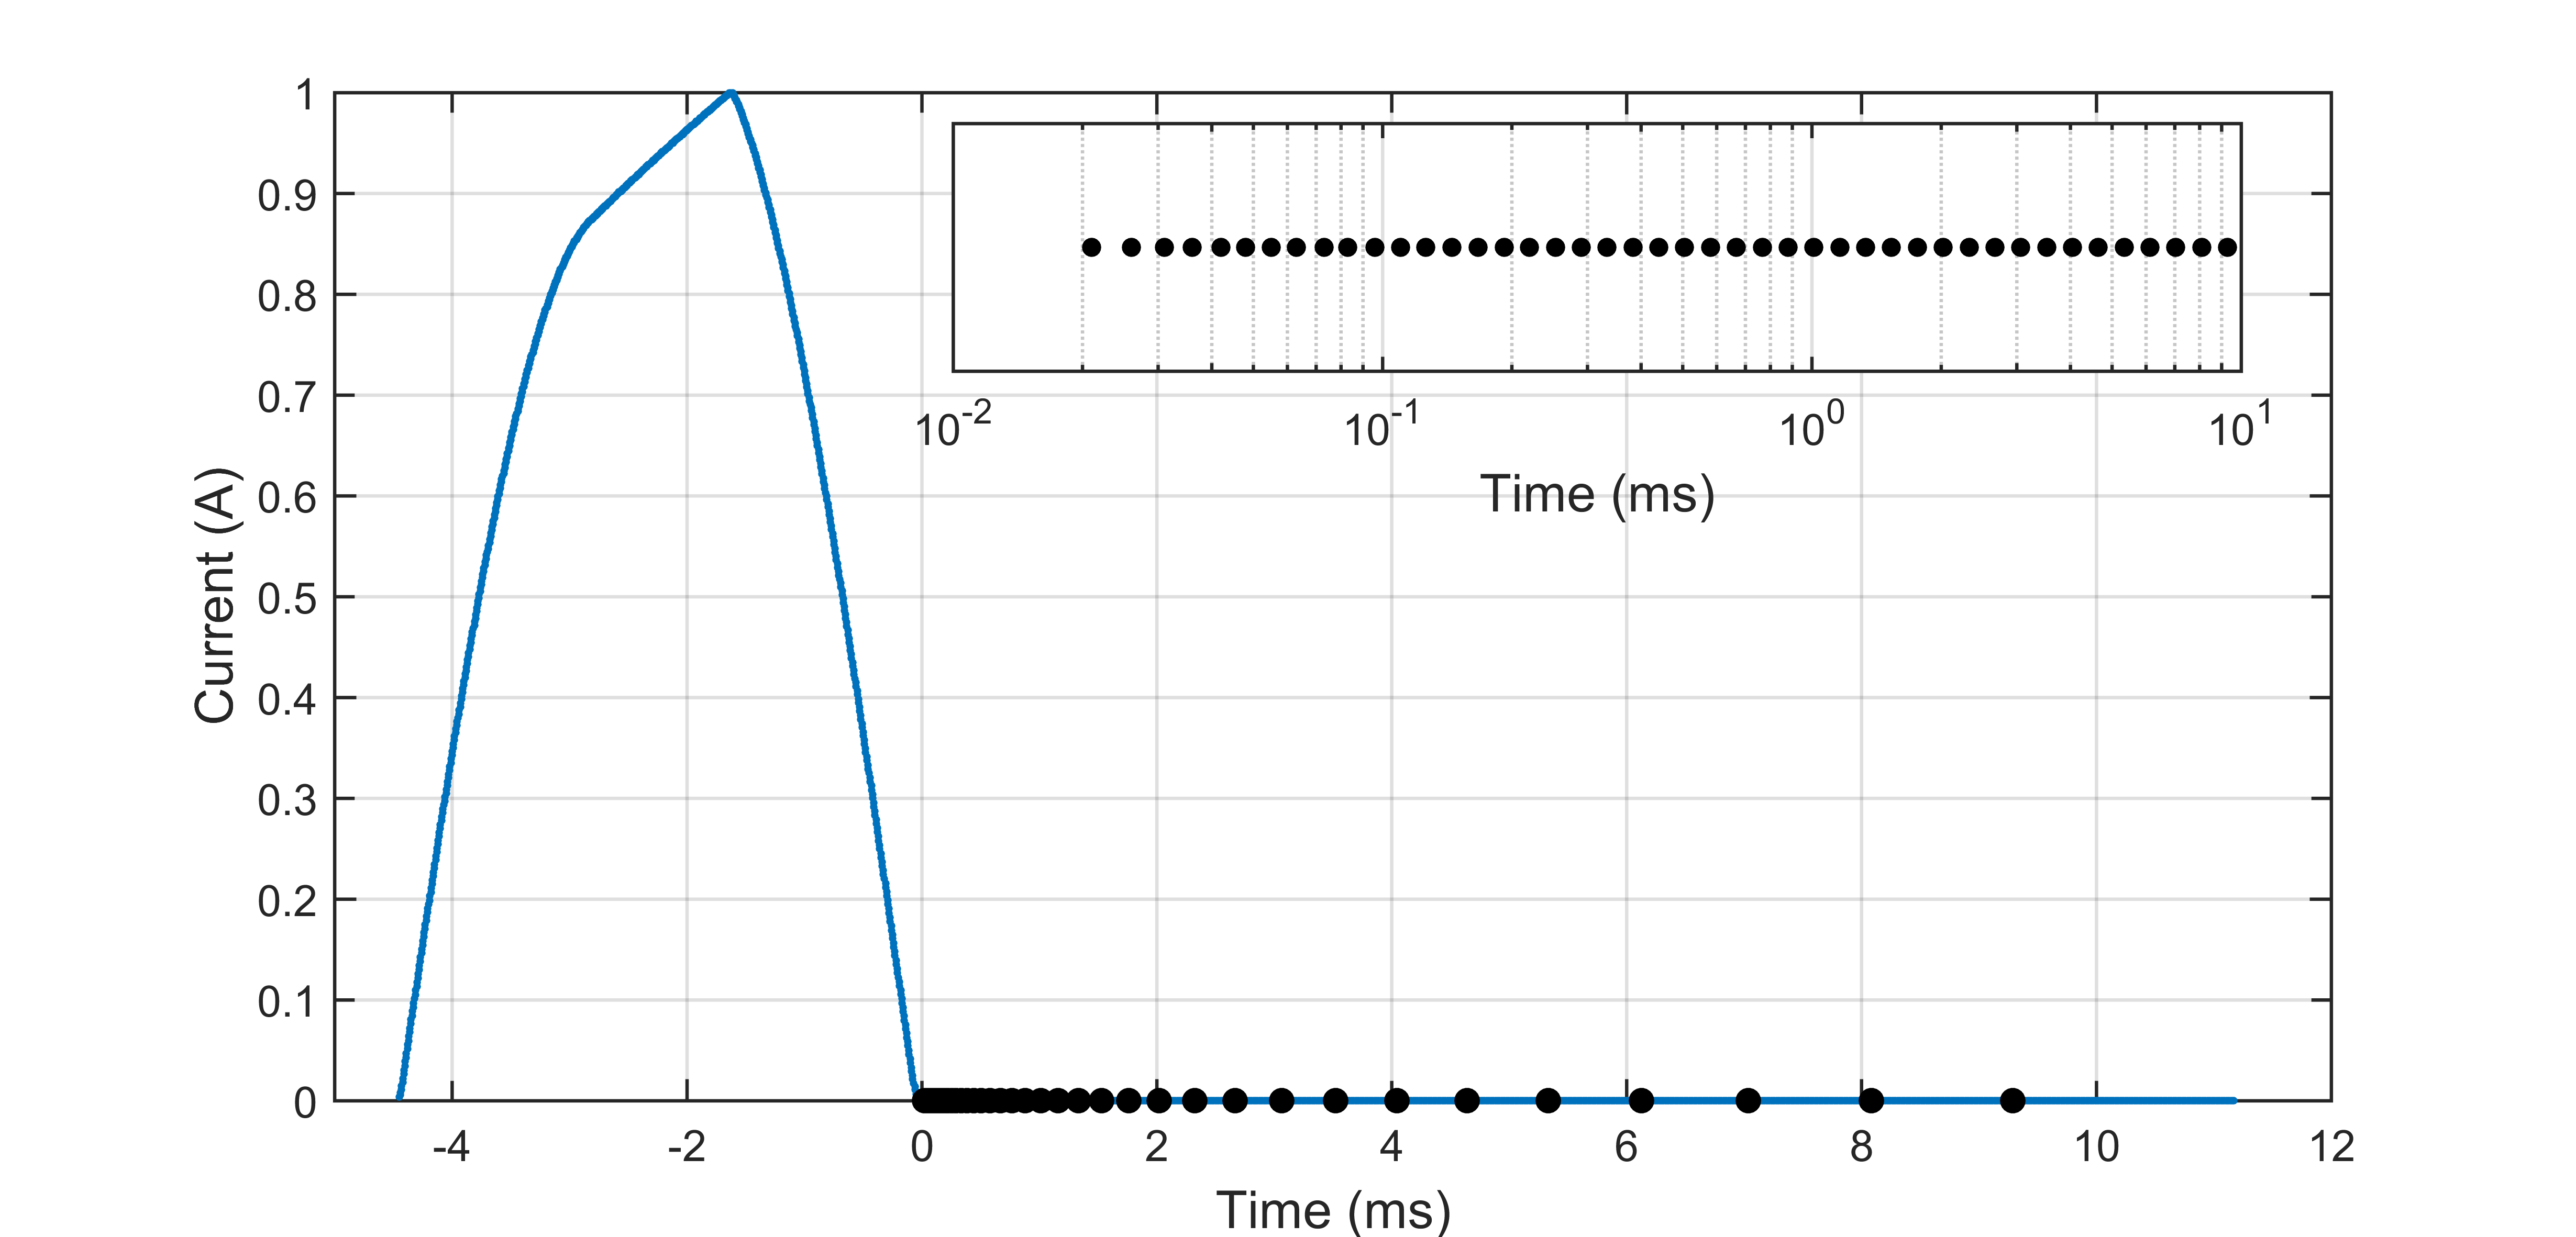
Fig. 294 The waveform for the 2014 VTEM survey is shown in blue. Black dots indicate the 44 time channels. The inset shows a closer look at the time channels on a logarithmic scale from \(10^{-5}\) to \(10^{-3}\) seconds.
The data at the Aspen property are collected using an airborne electromagnetic system call Versatile Time-Domain Electromagnetic (VTEM) which uses a helicopter-towed transmitter and receiver loop. The data were collected in February 2014 and a total of 1,095 line-kilometers were flown. Flight lines were oriented north-south with a spacing of 100 m for a total of 86 flight lines over a region that extends 8.7 km in the easting direction and 11.7 km in the northing direction. Twelve tie lines spaced 1,000 m apart were flown in the east-west direction. Fig. 293 shows the flight lines in relation to the property boundary. The data set contains a total of 428,340 data locations. More information about airborne TEM system can be found here.
For this data set, the data consist of the z-component of the time-derivative of the magnetic field (\(\partial \mathbf{B}_z/\partial t\)) and are measured at 44 off-time time channels. Fig. 294 shows the waveform and the different time channels ranging from 2e-5 to 9e-3 seconds after transmitter shut-off.
We now turn to looking at the data in detail on the next page.