Data
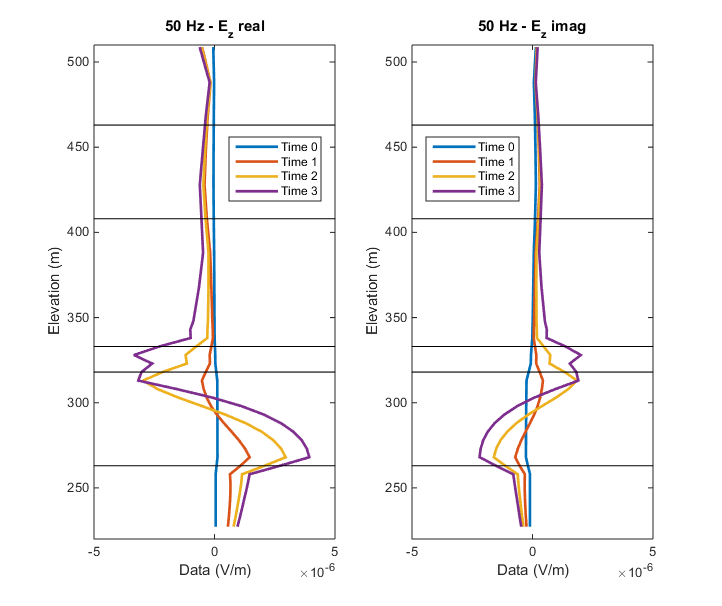
Fig. 490 The data show changes over time, especially within the reservoir (between 320 and 260 m).
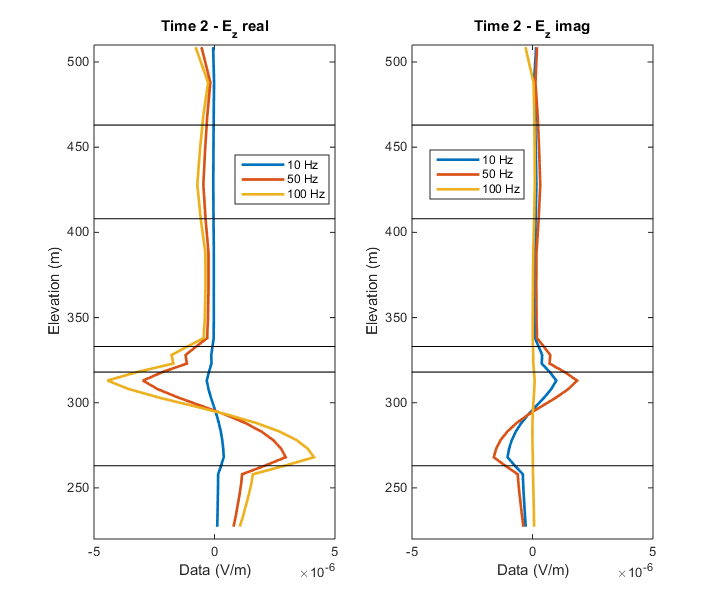
Fig. 491 The data show changes as frequency increases.
Because this is a synthetic example, the z-component of the electric field is forward modeled in 3D at each of the four time steps for the three selected frequencies using the survey and 2% Gaussian noise is added to the data.
Fig. 490 shows the data from a single borehole location at 50 Hz. We notice that the data changes within the reservoir as time increases. Time 0 indicates when there is no steam present while more steam is injected into the reservoir at Times 1, 2, and 3.
The data also change if the frequency increases, as indicated in Fig. 491. By examining multiple frequencies, we obtain more information than when only the DC component (0 Hz) is collected.
In order to relate these changes in the data to changes in resistivity, we invert the data.