Model-Driven MT Inversion
Data
Data corresponding to the model-driven MT inversion were discussed in the data-driven MT inversion section.
Processing
We start with the data-driven 3D MT inversion in Area-1 (Fig. 532 a and d), which achieves an excellent match with well data for the base of the salt layer. This interface represents the top of the conductive sediments and is an ideal target for the conductor-sensitive MT technique. The data-driven 3D MT inversion also shows excellent sensitivity to the basement structures such as tilted and uplifted fault bounded blocks.
Unfortunately, shallow resistivity structures (the top of the salt) recovered through MT inversion are poorly constrained (Fig. 532 a and d). Not only is the interface only several hundred meters below sea-level in some places, it also demonstrates a several order magnitude change in resistivity. Challenges in resolving shallow resistivity structures are due to the lower frequency content contained within the data and the large spacing between MT stations. Because of this, unconstrained 3D MT inversions tend to introduce clear footprints and tend to smear downward the position of the top LES interface.
To improve the results of the 3D MT inversion, a priori knowledge of seafloor bathymetry and the top of the LES from WAZ data are used to constrain the inversion. The resistivity of sea bottom sediments (PoES) are given a starting value according to well-log data (~0.32 Ohmm). Between the top LES and the interpreted base evaporite (base LES) surfaces we substitute the resistivity values in the model with a homogeneous resistivity of 20 Ohm-m; which is close to the average resistivity of the reconstructed salt from the data-driven MT inversion. The rest of the model (basement and PrES) is left untouched (Fig. 532 b and e).
The modified model (Fig. 532 b and e) is then used as a starting model for a new series of 3D inversions, where all the cells of the model are allowed to vary and where a “prior model” term (\(m-m_{prior}\)) in the objective function is minimized together with the data misfit only in the initial inversions.
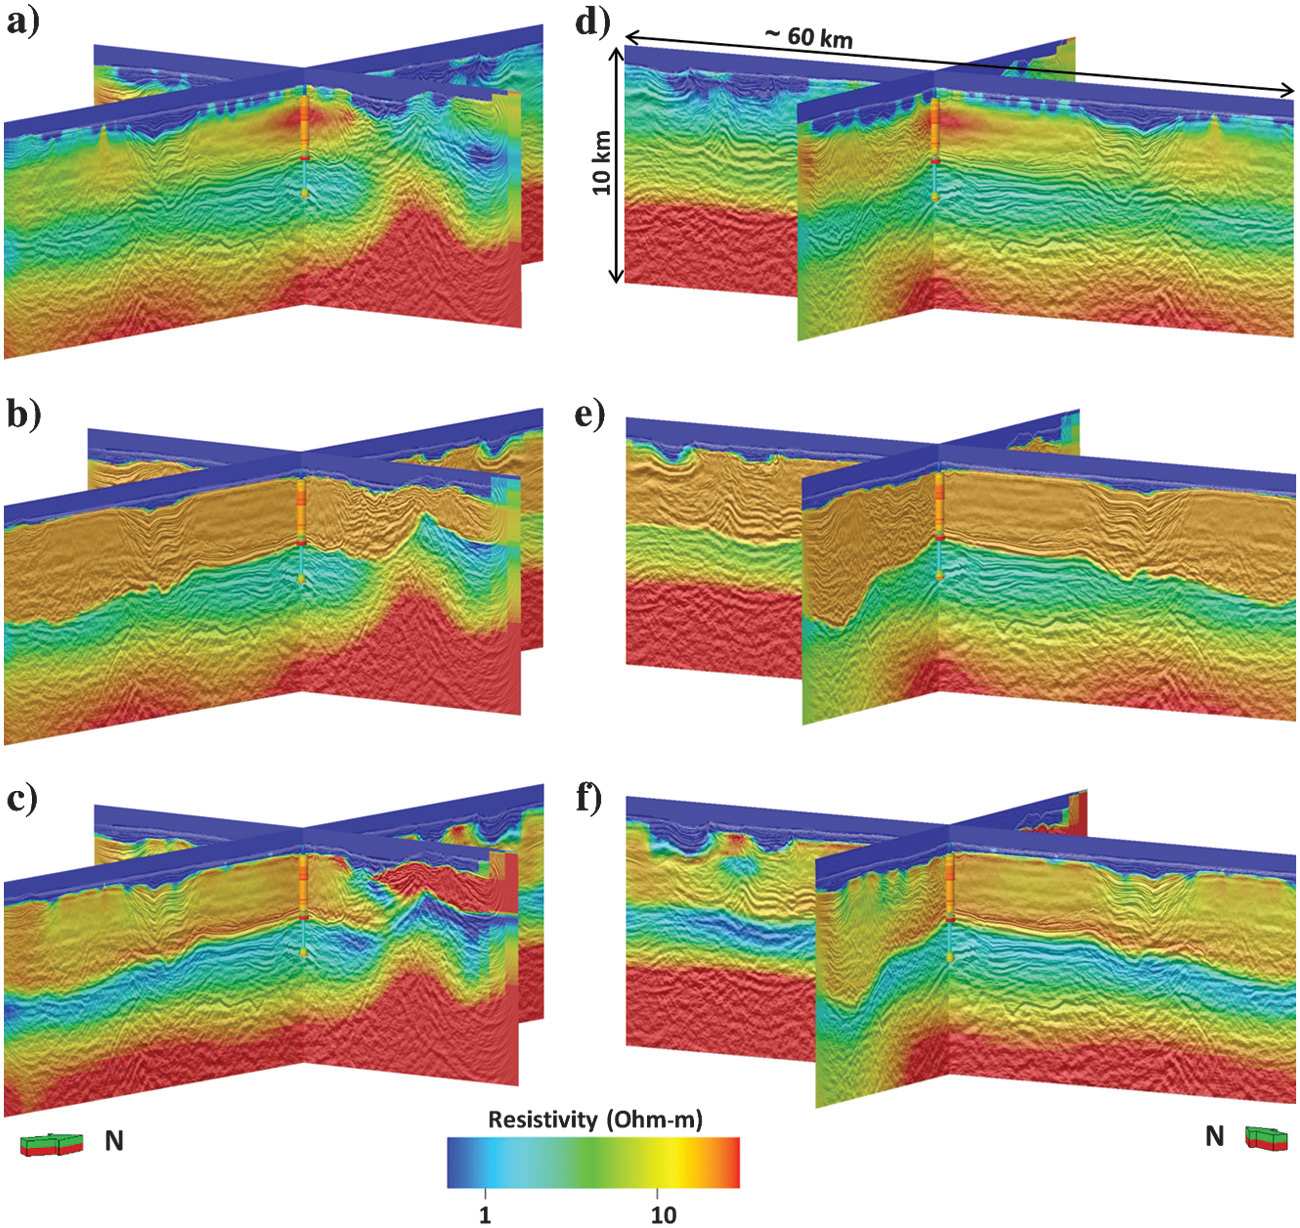
Fig. 532 Three-dimensional MT inversion results in area 1 shown along two central cross sections through the model. (a and d) Data-driven inversion results. (b and e) Modified start model obtained from the data-driven MT inversion result which is then modified using interpretation for the sea bottom sediments and the salt body. (c and f) Results of new 3D MT inversion from the new starting model where all the model cells are allowed to vary..
Interpretation
The 3D inversion obtained from the described procedure (Fig. 532 c and f) retrieves sharper resistivity images when compared to a purely data-driven procedure and adds details to the whole model section, including the top LES, the subsalt sediments (PrES) and the basement. Model-based results show that with the adoption of sensible constraints derived from multiparameter interpretation, the resolution of 3D MT inversion can be boosted to a level of accuracy that becomes attractive for seismic velocity model building operations. In the following section, we aim at further increasing the level of details by using model-driven 3D CSEM inversion and targeting primarily the hidden structures embedded in the complex LES overburden and the detailed geometry of halite bodies.