Data
Fig. 312 presents the ZTEM survey flight lines over the DEM (digital elevation model) and the aeromagnetic signature of the Cobre Panama region. The figure shows a correlation between relatively higher elevations and magnetic high anomalies over deposit area. The magnetic data shown in Fig. 312 b shows a recognizable pattern of magnetic highs from volcanic andesites due to primary magnetite [Bur14].
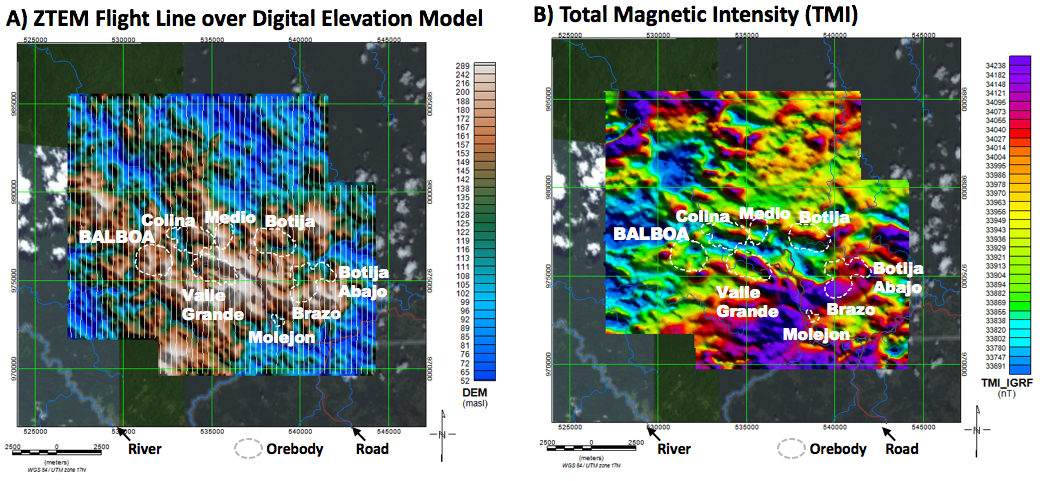
Fig. 312 ZTEM survey results over Cobre Panama deposit area: a) Digital Elevation Model (DEM), and b) Total magnetic intensity, showing porphyry deposit locations and drill-hole coverage prior to Balboa discovery (after [Bur14]).
As mentioned in previous Survey section, measured tipper data have both \(T_{zx}\) and \(T_{zy}\), and each of them has in-phase and quadrature components. Fig. 313 shows ZTEM tipper data at 90 Hz. \(T_{zx}\) data map shows large scale feature elongated to \(x\)-direction, whereas \(T_{zy}\) shows similar feature but elongated to \(y\)-direction. Quadrature component data shows much smoother variation in space compared to in-phase data.
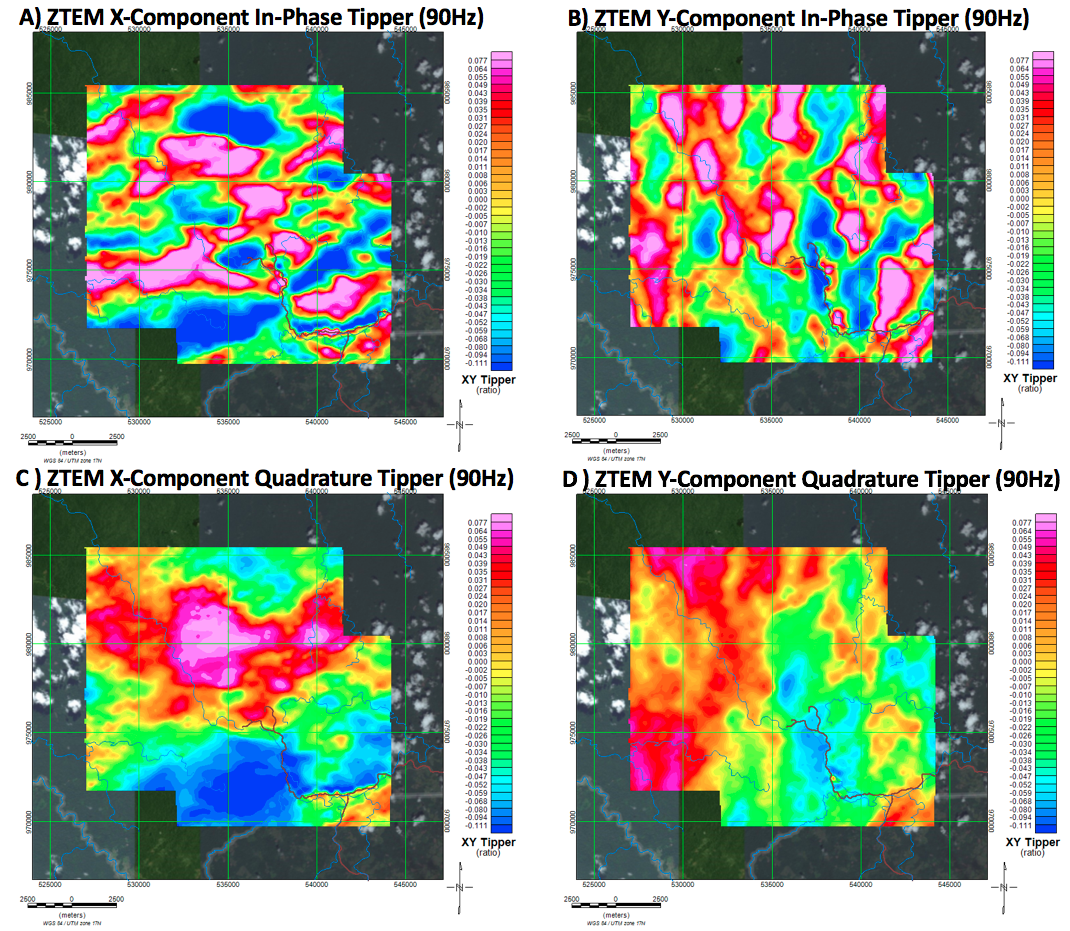
Fig. 313 Plan maps of Tipper data from a ZTEM survey over Cobre Panama deposit area at 90 Hz: a) ZTEM X-Component In-Phase Tipper, b) ZTEM Y-Component In-Phase Tipper, c) ZTEM X-Component Quadrature Tipper, and d) ZTEM Y-Component Quadrature Tipper.