Setup
Rock-property estimation (fluid saturation, porosity, and lithology) is the ultimate goal for geologists, geophysicists, and reservoir engineers. All seek to combine well and surface measurements to generate a model of rock properties that can be used to generate an exploration, appraisal, or exploitation plan and quantify the hydrocarbon resources available. Since hydrocarbon exploration began in the 19th century, technology and innovation have driven the process of subsurface rock-property prediction from exploration, solely based on surface geology, to the progressive inclusion of 2D seismic (early 1920s), gravity, magnetic, 3D seismic (late 1960s), AVO analysis ([Ost84]) and, most recently, controlled source electromagnetic (CSEM) data ([EEJ+02]).
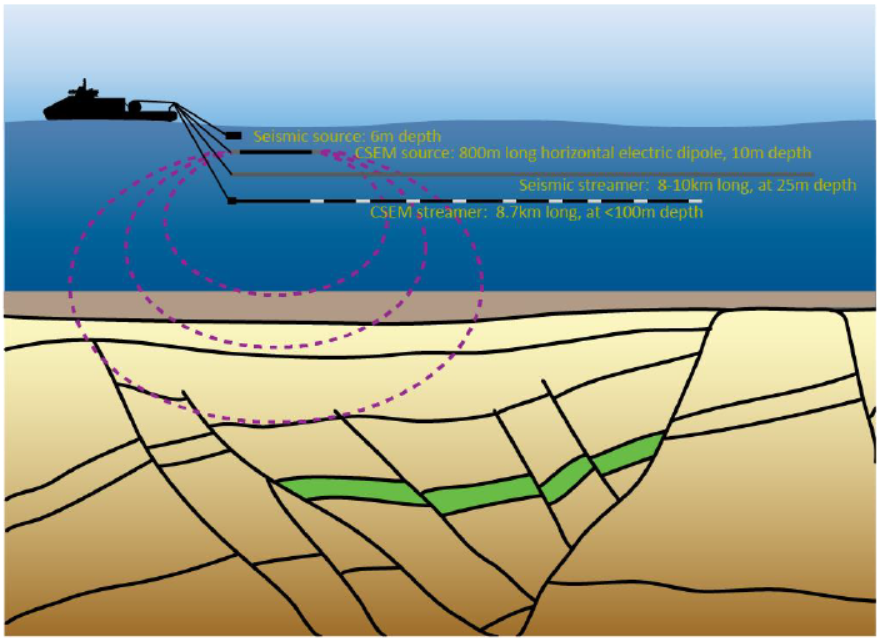
Fig. 321 Schematic showing towed CSEM and seismic instruments over the Hoop region, Barents Sea, Norway.
Nowadays the integration of pre-stack seismic inversion attributes with CSEM attributes using a rock physics framework constitutes one of the most modern and robust methodologies to carry out geophysical reservoir characterization (see for example [GAH12, HDM+09, Mac12]). Each method provides independent physical measurements of the subsurface that complement each other and can be validated by well log measurements and forward modeled at different reservoir conditions through the application of rock physics principles. Seismic provides the structural framework and, from AVO information, the possibility to derive P- and S-wave impedance volumes. These two valuable, independent measurements can be linked to porosity, lithology, geomechanical properties, and, under certain conditions and limitations, to fluid saturation prediction. On the other hand, CSEM data provide a lower resolution measure of resistivity, which, when constrained with the structural framework and seismically derived volumes of porosity and lithology, can be linked to fluid saturation, overcoming seismic ambiguity related to similar AVO responses in both low- and high-saturated hydrocarbon reservoirs.
However, there are a number of challenges to be overcome when putting seismic and CSEM data together. Electric and elastic properties must be coupled through a single earth model that accurately and consistently describes each. There must be overlap in sensitivity of the methods applied to the properties within the intervals of interest. Finally, seismic, CSEM and well log data sample the earth at very different scales, which must be reconciled in an integrated interpretation.
The integration process itself can take many forms. The simplest qualitative techniques, such as co-rendering, are applicable everywhere and provide a first-look approach to data combination. However, they can be misleading since they fail to address the underlying cause of variations observed. Full quantitative joint inversion of seismic and CSEM data is in principle possible (for example [CH12, DM10]), but is complex and applicable in a far narrower range of circumstances. An intermediate approach, based on a sequential quantitative integrated interpretation workflow, which seeks to integrate elastic and electric attributes derived from inversion of seismic and CSEM data respectively, provides in many circumstances an effective way of addressing the challenges of data integration.
This paper presents a case study in which the latter integration approach has been applied to overcome the challenges of the integration of seismic and CSEM data and successfully predicts a seismic-resolution fluid saturation volume that helps characterize the reservoir and diminish the risk related to the exploration and appraisal of the prospects in the study area. The area in question covers a significant oil discovery in the Hoop Fault Complex on the Bjarmeland Platform in the Barents Sea, Norway (Fig. 322 a).
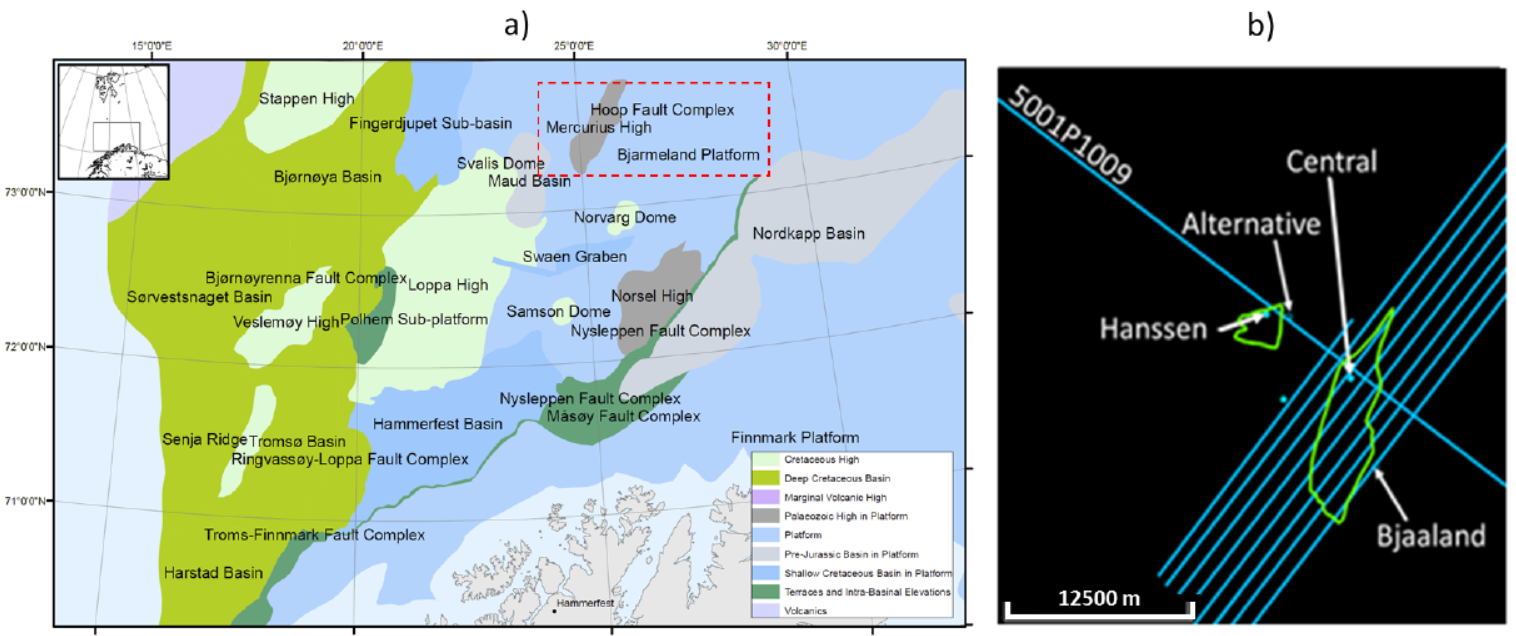
Fig. 322 Geologic Setting. (a) Structural elements of the Barents Seas showing with a red box the location of the studied area ([HMujezinovicR13]). (b) Detailed view of the studied area showing the location of the 2D GeoStreamer® seismic and towed streamer CSEM data (blue lines), as well as the calibration well (Central and Alternative) and the validation wells (Hanssen and Bjaaland). The green outlines show the location of the proven reservoirs in the area (data courtesy of NPD), which were discovered by the wells Central and Hanssen.
Geology
Several sedimentary basins and platform areas make up the Norwegian sector of the Barents Sea. The general structural configuration in the area of interest is to a large extent dominated by the Hoop Fault Complex on the Bjarmeland Platform (see Fig. 322 a). The area of interest is positioned on the hanging wall of the Hoop Fault Complex to the east and on the footwall of the Maud Basin. Fig. 323 shows a seismic cross-section illustrating the general nature and structure of the area.
The Realgrunnen Subgroup of the Kapp Toscana Group provides some of the best reservoirs in the Barents Sea. It is subdivided into four formations: Fruholmen, Tubåen, Nordmela and Stø. The Nordmela Formation (Sinemurian-Late Pliensbachian) consists of interbedded siltstones, sandstones, shale and mudstones with minor coals. Sandstones become more common towards the top. The formation represents deposits in a tidal flat to flood-plain environment. Individual sandstones represent estuarine and tidal channels. The Stø Formation (Late Pliensbachian to Bajocian) is defined with the appearance of sandy sequences above the shale-dominated sediments of the Nordmela Formation. The dominant lithology of the Stø Formation is mineralogically mature and well sorted sandstone. The sands in the Stø Formation were deposited in prograding coastal regimes, and a variety of linear clastic coast lithofacies are represented. Marked shale and siltstone intervals represent regional transgressive pulses in the late Toarcian and late Aalenian. Overlying the Stø Formation is the Fuglen Formation, which belongs to the Adventdalen Group. The group is dominated by dark marine mudstones, locally including deltaic and shelf sandstones as well as carbonate. The Fuglen Formation constitutes the cap rocks of the reservoir facies ([HMujezinovicR13]).
The study area is significantly uplifted, and characterized by high background resistivity and high electrical anisotropies. Target intervals exist in a wide range of depths, ranging from about 250m below mudline to nearly 2000m below mudline. The reservoir encountered in well 7324/8-1(Wisting Central) consists of the Stø and Nordmela Formations, overlying the Snadd Fm. of upper Triassic age. The Stø Fm. is marked by a sharp contact with the overlying Fuglen Fm., seen both on logs and on drilling parameters. The Stø Fm. consists of 20m clean and homogenous sand, with very good reservoir properties. This is confirmed both by wireline log data and core measurements.
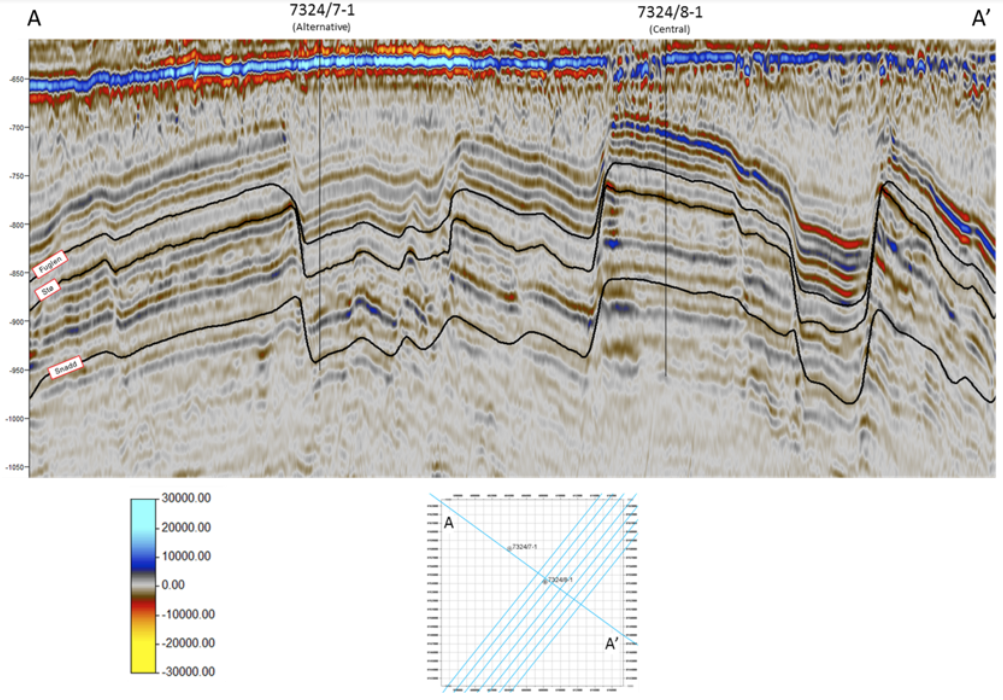
Fig. 323 Seismic cross-section through though the wells Alternative and Central. The top Stø horizon marks the top of the reservoir interval encountered in the Wisting Central well (7324/8-1).