Processing and Interpretation
Fig. 314 a and b present the mag data before reduced-to-pole (RTP) and after RTP, respectively. Although large scale magnetic high anomalies aligned with higher elevations do not change; however, close to the known porphyry deposits there are significant differences. For instance, close to Botijia magnetic anomaly was high before RTP, however this changed to low anomaly after RTP. Overall all the known porphyry deposits are noticeably centered on magnetic lows, possibly representing demagnetized areas due to phyllic alteration [Bur14]. Exceptionally, Balboa coincides with a positive magnetic anomaly, which, along with the lack of geochemical anomaly due to thick leach- cap (G. Wells, pers. comm., 01-2016), masked it in previous exploration phases [Fis14].
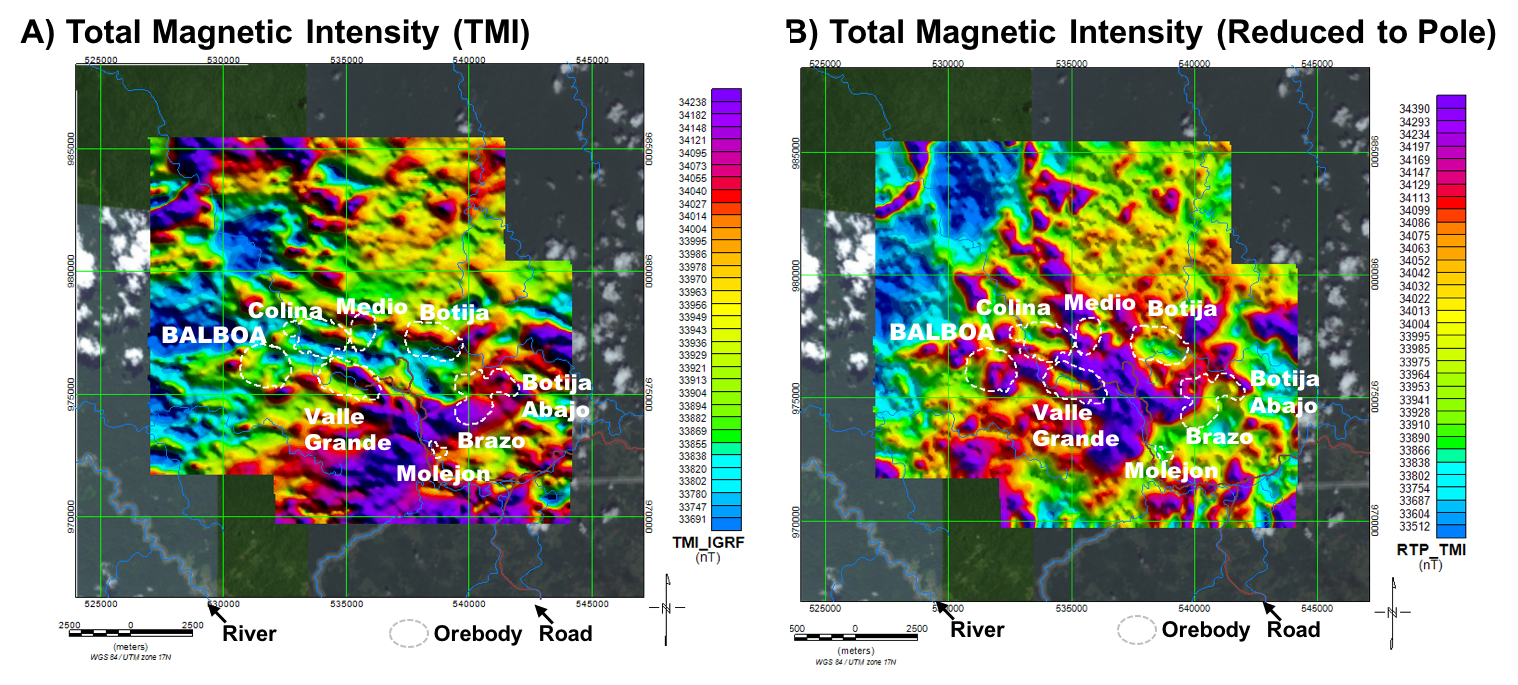
Fig. 314 Magnetic data from a ZTEM survey over Cobre Panama deposit area: a) Raw total magnetic intensity (TMI), and b) TMI data after reduced to pole.
Fig. 315 presents the ZTEM tipper data, displayed as the Total Phase Rotation (TPR; [ILF11], [LO12]), at both high and low frequencies, giving a sense of relative depth of investigation. In spite of possible topographic artefacts [SW12], the differences in the two TPR signatures are noticeable and, as noted by [Bur14], the higher frequency (shallow depth) ZTEM results ( Fig. 315 a) appear to map elevated conductivity closely associated with all the known porphyry orebodies; whereas the anomalies that persist at low frequencies (Fig. 315 b) also coincide with known deep sulphides zones at Botija and Brazo-Botija Abajo, as well as the untested anomaly Balboa northwest of Cuatra Crestas prospect [Bur14]. The low frequency ZTEM image in Fig. 315 b also displays a large/long wavelength negative tipper response in the Cobre Panama deposit region that suggests anomalously higher resistivities at depth.
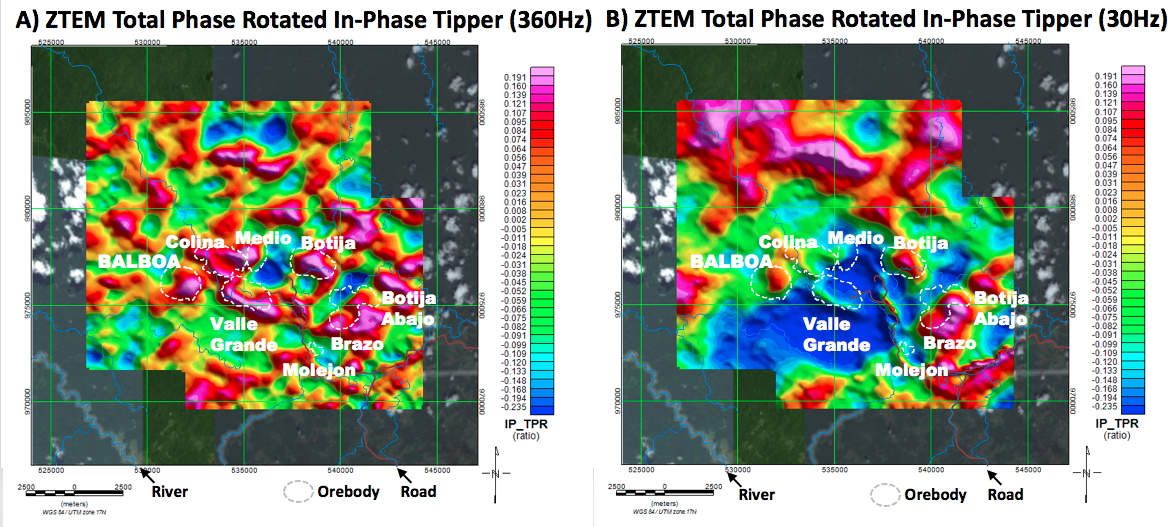
Fig. 315 ZTEM survey results over Cobre Panama deposit area: a) Total phase rotated (TPR) In-phase tipper at 360Hz, and b) In-phase TPR at 30Hz, highlighting EM anomalies that extend to lower frequencies over the Botija, Brazo and Botija Abajo porphyry deposits, as well as the Balboa discovery.
The ZTEM data have been converted to equivalent resistivity-depth distributions using from 2D and 3D ZTEM inversions using the Geotech Av2dtopo code [LWG+12] and UBC MT3dinv code [HOO08], respectively. The ZTEM 2D inversions were performed on the \(T_{zx}\) (in-line) component data, using an avg. 30mX by 40mZ cell mesh. The 3D ZTEM inversion used both the \(T_{zx}\) and \(T_{zy}\) data, and a 150m x 300m x 40m cell mesh. Both inversions accounted for topography and used a 500 ohm-m half-space apriori start model. Fig. 316 a presents the 2D resistivity depth slice at 0m and Fig. 316 b presents the 3D inversion result at -500m depth as an overlay on the 2D depth slice, for comparison. The images in Fig. 316 a and b resemble quite closely the high and low frequency TPR images shown in Fig. 315 a and b; in particular the shallow conductivity anomalies observed over all the known porphyries, as well as higher conductivities associated with the higher grade deposits, including Balboa, that are highlighted in the deeper inversion images and were predicted by the known geology. Below 500-1000m, the ZTEM 2D and 3D inversion results also indicate increasing resistivities extending to depth, as shown in Fig. 316 b.
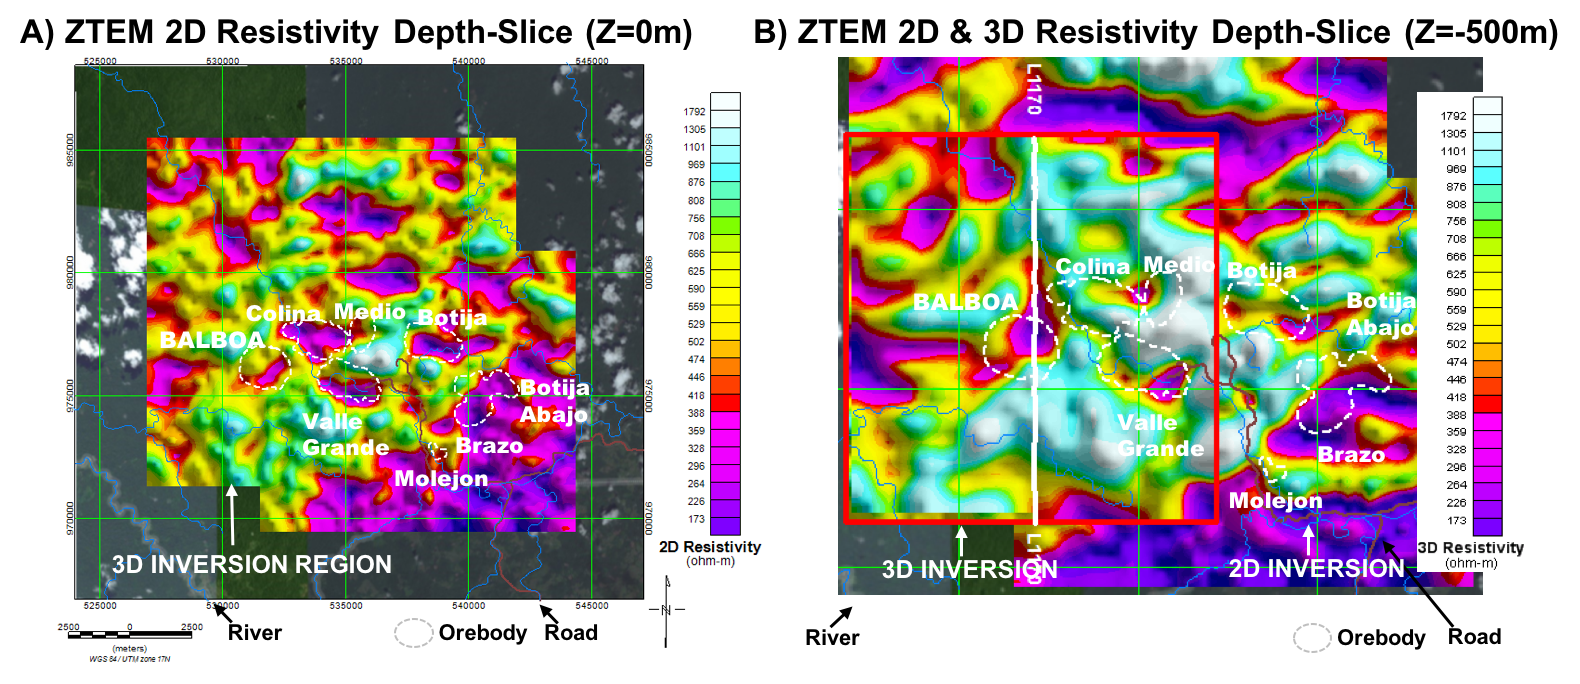
Fig. 316 ZTEM 2D-3D inversion results over Cobre Panama deposit area: a) 2D resistivity depth slice at 0m depth, showing 3D inversion region (red polygon) and b) Close-up of 2D & 3D resistivity (red polygon) at -500m depth and location of L1170 profile presented in Fig. 318 b and c.
Northing section (looking west) of both 2D and 3D inversions at L1170 are respectively shown in Fig. 317 a and b. In addition in Fig. 317 c, a section of susceptibility model obtained from 3D MVI inversion is presented. From resistivity sections from both 2D and 3D inversions, we can clearly recognize a strong dipping conductor near Balboa deposit. Although, main resistivity structures from 2D and 3D inversions are similar, there are some detailed difference. For instance, dip of the recovered conductors are significantly different between 2D and 3D, and also recovered conductivity in 3D inversion is higher than 2D. Considering 3D effects ignored in 2D inversion these are reasonable results because 2D assumes infinite length of conductor in strike direction. A low susceptibility anomaly, which is similarly dipping, is also imaged close to Balboa deposit. Recalling that the expected physical properties of the mineralized zone are high conductivity and low susceptibility, the fact that the recovered region also features high conductivity and low susceptibility can be considered as a satisfactory result of the 3D inversions.
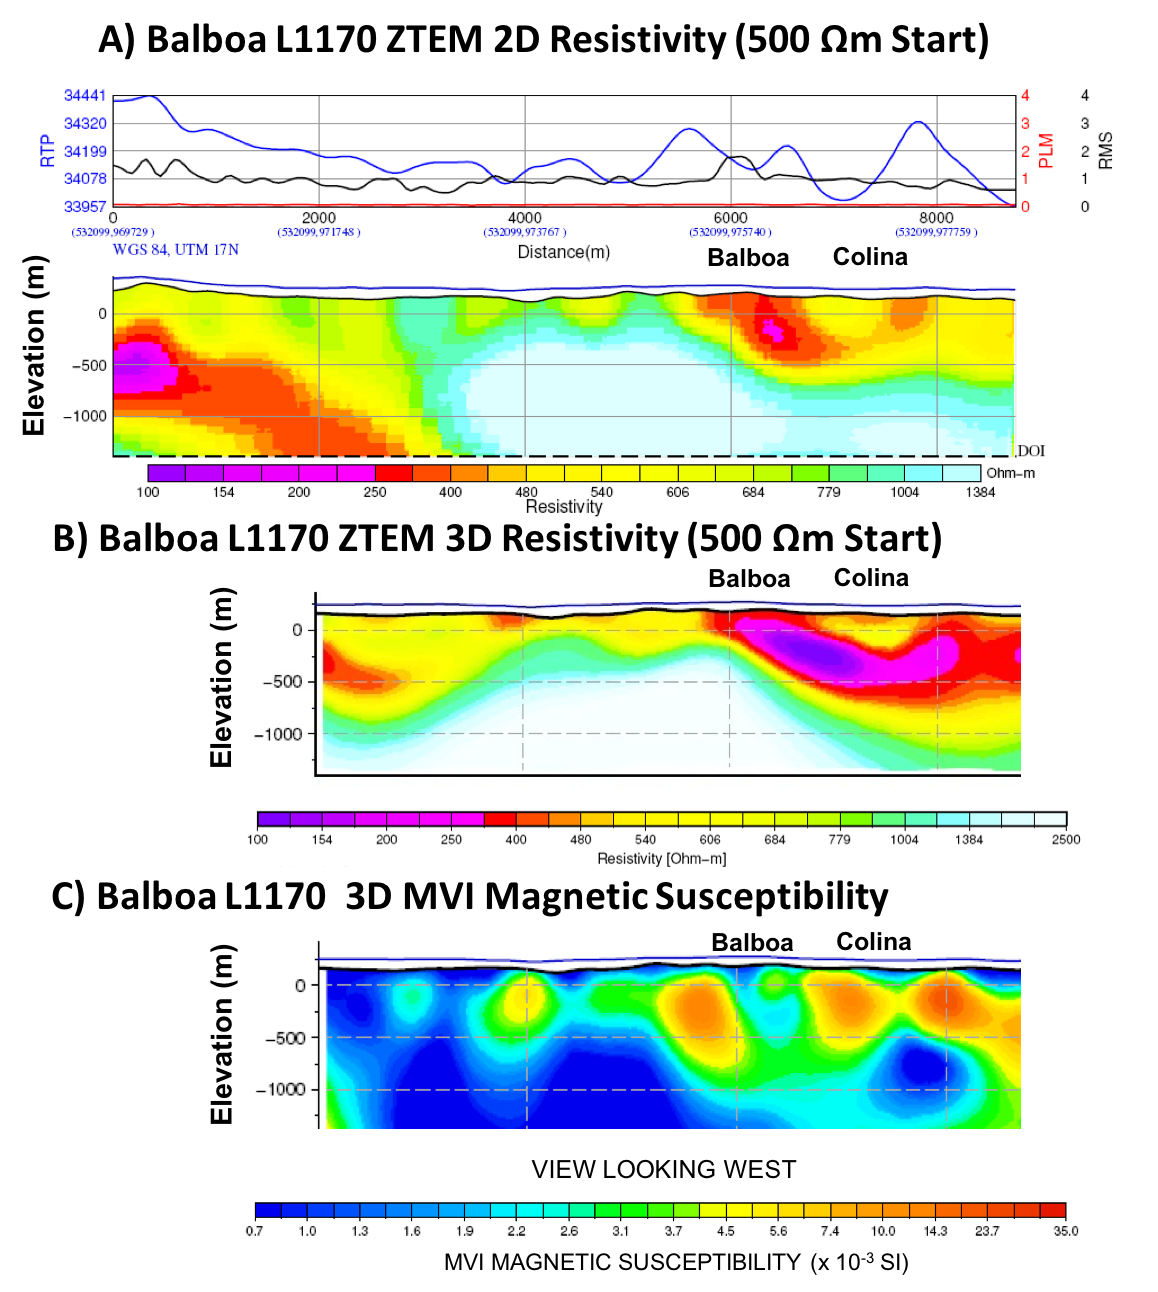
Fig. 317 ZTEM 2D-3D inversion results over Cobre Panama deposit area: resistivity section at line L1170 from a) 2D and b) 3D inversions are presented. In (a) both magnetic profile after RTP and RMS error of the 2D ZTEM inversion at L1170 is provided. (c) 3D MVI magnetic susceptibility inversion result at L1170.