Survey
Helicopter-borne geophysical surveys were carried out over the Cobre Panama Project from August 26th to September 8th, 2010, on behalf of Minera Panama SA and Inmet Mining Ltd., now owned by First Quantum Minerals since 2013. Principal geophysical sensors included a Z-Axis Tipper electromagnetic (ZTEM) system, and a caesium magnetometer (Fig. 310). A total of 831 line-kilometers were flown along 300m spaced, north-south oriented flight lines, with nominal EM bird terrain clearance of 85 meters and a magnetic sensor clearance of 102 meters. The 246 km \(^2\) survey block features moderate relief, with elevations ranging from 42 to 415 meters above sea level (Fig. 310 a). Flown early in the Cobre Panama mine development, the survey area had minimal culture, such as roads, trails and few buildings.
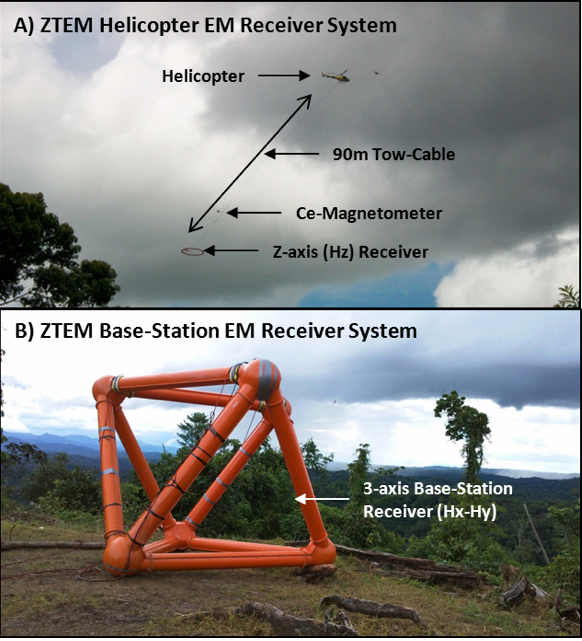
Fig. 310 ZTEM EM system during survey at Cobre Panama project, showing: a) Mobile Z-axis receiver measuring HZ, and b) Fixed base-station receiver, measuring \(H_x\) and \(H_y\) (after [Bur14]).
The ZTEM airborne AFMAG [War59] electromagnetic system measures the anomalous vertical secondary magnetic fields that are created by the interaction between naturally occurring, plane wave audio frequency EM fields, caused by distant electrical sferic/lightning storm activity, and electrical heterogeneities in the earth. In ZTEM surveys, a single vertical-dipole air-core receiver coil measuring the vertical magnetic field \(H_z\) (Fig. 310 a) is flown over the survey area in a grid pattern, similar to regional airborne EM surveys. Orthogonal, air-core horizontal axis coils (Fig. 310 b) are placed close to the survey site to measure the horizontal EM magnetic reference fields (\(H_x\) and \(H_y\)). Data from the three coils are used to obtain the Tzx and Tzy Tipper [LBMC85] components at six frequencies in the 30 to 720 Hz (or 25 to 600 Hz) band, according to the following equation by [HO10a]:
where \(H_z(r)\) is the magnetic field measured at the mobile receiver (r) and \(H_x(r_0)\) and \(H_y(r_0)\) are the magnetic fields at a fixed base station reference site (\(r_0\)).
The EM primary fields used in AFMAG have the unique characteristic of being uniform, planar and horizontal, and also propagate vertically into the earth, to great depth, up to several km, as determined by the magnetotelluric (MT) skin depth (δS) according to the following by [Voz72]:
where \(\rho\) is the bedrock resistivity (\(\Omega m\)), \(f\) is the frequency of measurement (hertz).
Can ZTEM see Balboa deposit below conductive cover?
Although it seems likely to relate to hydrothermal alteration, the source of conductivity for Balboa and the other porphyry ore bodies has not been determined with certainty, since the sulphide ore is disseminated and non-supergene enriched. Subsequent to the Balboa discovery, a helicopter time-domain EM (HTEM) survey was flown to determine the overburden characteristics for mine-development purposes. The HTEM survey resolved the 10-30m conductive saprolite layer but did not appear to detect the conductive anomalies related to the deeper porphyry bodies. Since ZTEM is relatively insensitive to horizontal layering [SW12], the 2D-3D inversions do not appear to define the conductive blanket either (see Fig. 316 b). A synthetic 2D model (Fig. 311 a) that replicates the Balboa deposit, from the 3D inversion result in Fig. 316 b, was tested using a 30m thick, 30 ohm-m surficial layer, based on the HTEM evidence. As shown in Fig. 311 b, in spite of the presence of the conductive blanket, a dipping conductive anomaly, extending to 750m depth and very similar to the Balboa response, is defined in the 2D ZTEM inversion result, which would appear to confirm its detectability using passive airborne electromagnetics.
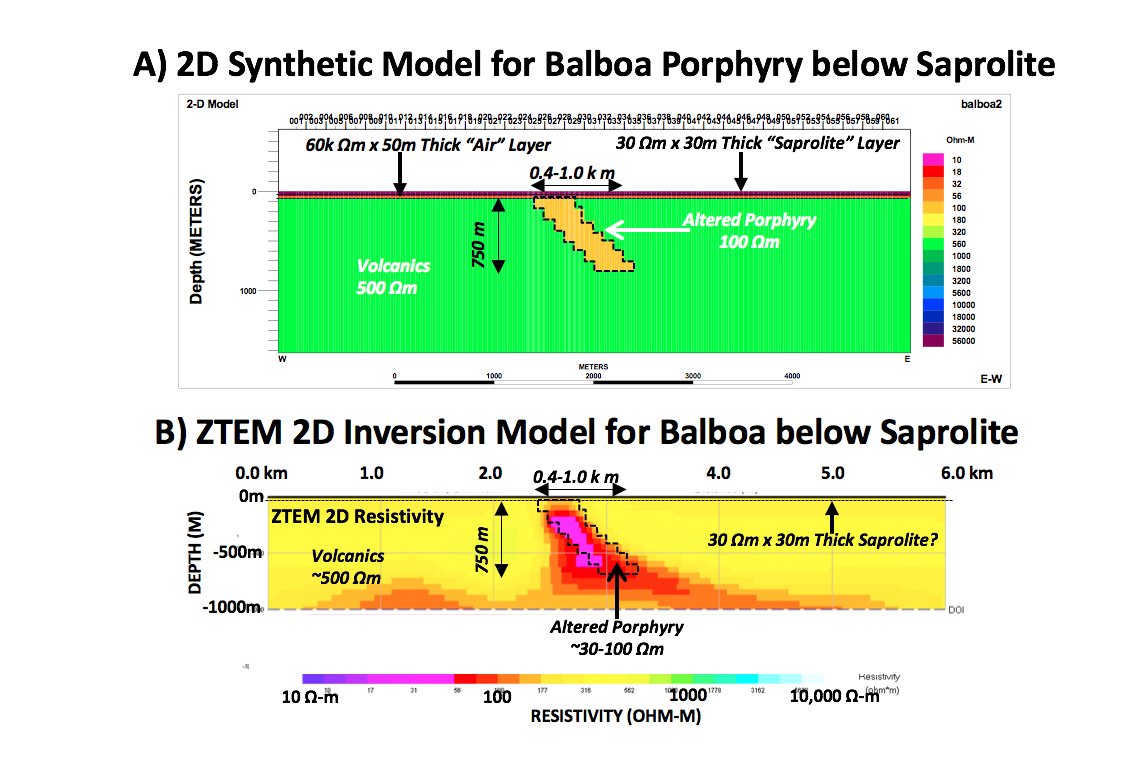
Fig. 311 ZTEM 2D synthetic modeling: a) 2D resistivity model for a porphyry body, resembling Balboa, buried below 30m of conductive saprolite (30 Ω-m), and b) 2D inversion of synthetic ZTEM data from model in Fig. 311 a.