Interpretation
The apparent resistivity and phase plots can be interpreted direcly but that becomes increasingly more difficult for complex, three-dimensional structures. In addition, the plots do not provide the actual resistivity nor any true depth information. To recover these, we invert the MT data.
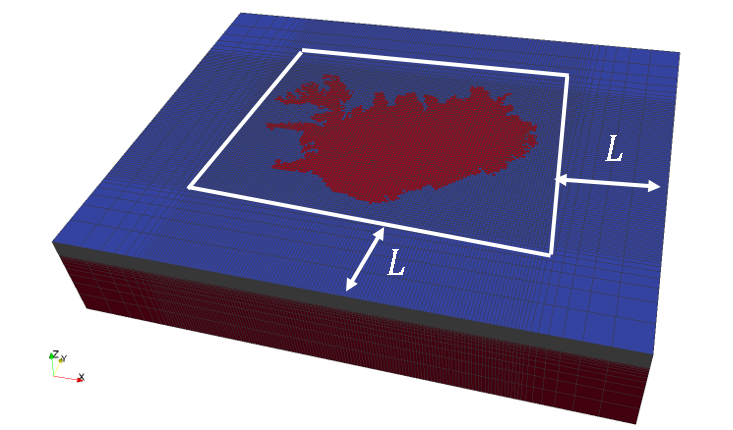
Fig. 206 When inverting MT data, it is important to use an extended mesh to properly consider the boundary conditions. Sometimes, current channeling can affect the inversion, such as from an ocean (highly-conductive) near the survey region.
The inversion of MT data is similar to that of controlled-source electromagnetic data except for a few additional considerations. First, it is additionally important to consider the boundary conditions when modelling MT data because the source fields are very large. Thus, a mesh with an extended grid where the edges extend a few skindepths (\(L\)) from the survey region is recommended, as indicated in Fig. 206.
Secondly, because the source fields are very large, the data are sometimes affected by channeled currents, such as when a large conductor (ocean) is nearby the survey region.
Otherwise, the inversion of MT data is essentially the same as that of controlled-source EM data.
Examples
Todo
invert the 1D example from physics section
Todo
invert the sphere from physics section