Data
Purpose
To show how measured voltages are converted to apparent resistivity and plotted as a sounding curve or as a pseudo-section.
A general DC resistivity survey setup is outlined in Fig. 159. A current generator is attached to the \(A\) (positive) and \(B\) (negative) electrodes and a current of magnitude \(I\) is injected. \(M\) and \(N\) are the potential electrodes. The nomenclature for referring to the distance between any two electrodes is denoted by \(r\) with appropriate subscripts. The electrodes can be deployed anywhere on the surface or in boreholes and they do not have to be co-linear.
Fig. 159 The measured voltages constitute the data. Distances between the electrodes are used to calculate the geometry factor and apparent resistivity discussed below.
Measured potential differences
The flow of currents in the ground causes charges to be built up on interfaces between regions of differing conductivity. These charges contribute to the measured potential difference.
In a uniform halfspace, the measured potential difference is given by the following expression:
where \(G\) is a geometric factor which depends upon the geometry of the electrodes, \(I\) is the magnitude of the injection current, and \(\rho\) is the halfspace resistivity.
Calculating apparent resistivity
The measured voltages are numbers that can vary greatly in amplitude and they provide no direct insight about the structures at depth. As shown above, the potential difference is primarily dependent upon the geometry of the electrodes. By rearranging that formula, we can recover the true resistivity
When the earth is a halfspace, any DCR datum is sufficient to evaluate the halfspace resistivity. For field data, it is still useful to eliminate the geometrical factor and define
We refer to \(\rho_a\) as the apparent resistivity and it is understood to be the resistivity of a halfspace which produces the observed potential measured by a particular electrode geometry. Apparent resistivity is equal the earth’s true resistivity only when the earth is a uniform halfspace. When the earth is more complicated, the measured apparent resistivity will lie between the maximum and the minimum of the true resistivities. This conversion of voltage measurements to apparent resistivity is extremely valuable for plotting data and making first assessments about the subsurface. If apparent conductivity is preferred (and these are often used interchangeably), the expression becomes:
Visualizing data
Sounding
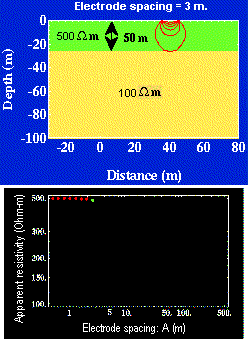
For DC resistivity soundings, plots of the apparent resistivity versus current electrode separation are often created. For simple horizontally layered environments, these sounding curves provide insight into the relative thickness and resistivity of layers (as shown in the interactive figure below).

Pseudosection
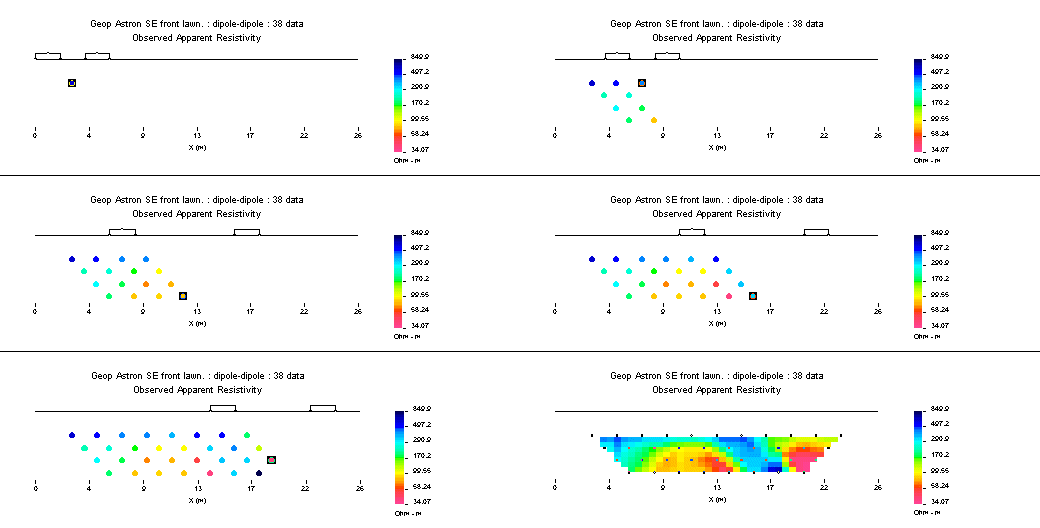
Pseudosections are often used to visualize data from 2D profiles. To account for the fact that measurements with larger electrode separations sample deeper portions of the earth, lines at \(45^\circ\) degree angles, are drawn from the mid-points of the current and potential electrode pairs and the datum is plotted at the intersection of these lines. In cases where a pole transmitter or receiver is used, the \(45^\circ\) lines are drawn directly from the electrode location. The figure below shows how an apparent resistivity pseudosection is built for a simple dipole-dipole profile.
Table 2 : Apparent resistivity pseudosection
Finished pseudo-section.
Animation.
On the following page, we show how these plots can be utilized to increase our understanding of the subsurface and discuss some of their limitations.
