Physics
Purpose
Demonstrate the fundamental physical principles governing the DC resistivity experiment
In a DC resistivity survey, a generator is used to inject current into the subsurface. Currents flow, and the path they follow depends on the conductivity structure of the subsurface. Charges build up on conductivity interfaces and these change the electric potentials that are measured on the surface or in boreholes.
| Figure 2. Click buttons for images a. through e. | |||||||||||||||
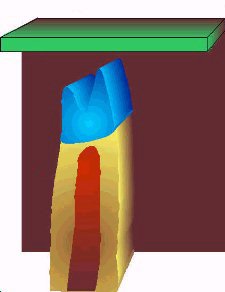
| a. | The Elura ore body. Depth to top of gossan (in blue) is approximately 100 m. | ||||||||||||||
| b. | A DC resistivity survey involves injecting current at one location and measuring resulting potentials at another location. | ||||||||||||||
| c. | Current will flow. Current density increases within conductive regions, and decreases within resistive regions. | ||||||||||||||
| d. | Charges build up at interfaces between regions of different electrical conductivity. | ||||||||||||||
| e. | Variations in charge distribution are detected as variations in distribution of potential, or voltage, at the surface. | ||||||||||||||
| |
 |
Elura Orebody Electrical resistivities | |||||||||||||
Two-sphere problem
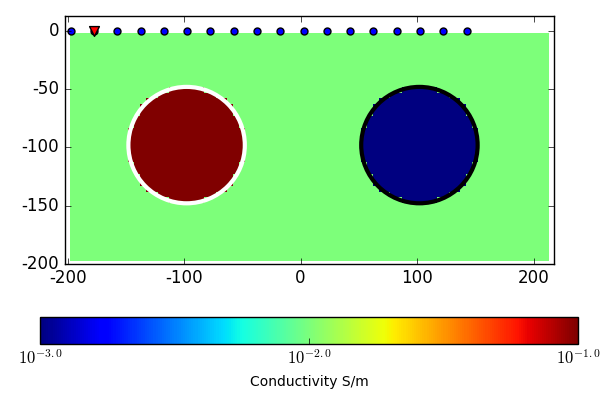
Fig. 146 Pole-dipole DCR experiment over a synthetic model made up of a conductive (\(10^{-1}\) S/m) and a resistive (\(10^{-3}\) S/m) sphere embedded in a uniform half-space (\(10^{-2}\) S/m).
We illustrate the DCR experiment with a synthetic pole-dipole survey as illustrated in Fig. 146. This simple conductivity model is made up of two spheres in a uniform half-space Earth. Currents are injected into the ground from the source, and potentials are measured at different locations. Using numerical methods, we can model the currents and accumulation of charges due to conductivity contrasts as shown in the animation below. The arrows denote the direction of the current density, while the color indicates the strength and sign of accumulated charges. The source location is marked by a triangle.
[Press play] Note the behaviour of the current lines as the point source passes over the conductor. The current density increases inside the sphere but decreases around it; this is often referred to as current channeling. Conversely, current lines get deflected around the resistor.
[Pause] Charges accumulate at the interface between conductivity contrasts. Note the difference in charge polarity as the current flows into the conductive and resistive spheres. The polarities agree with those predicted by theory. Also note how the spatial distribution of charges on the spheres changes as the current source is moved.