Survey
Purpose
To provide an overview of common survey set-ups and instrumentation used in DC resistivity surveys.
Basic Survey Setup

Fig. 147 The basic DC resistivity array using 4 electrodes. A and B are the current electrodes while M and N are the potential electrodes. Distances between the electrodes are used to calculate the geometry factor and apparent resistivity.
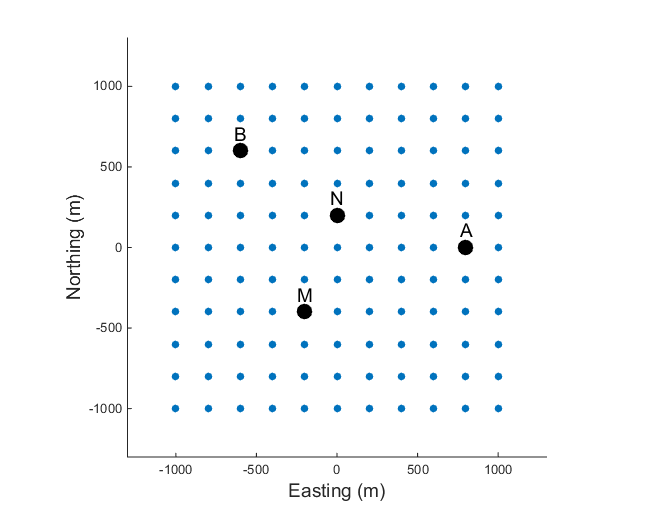
Fig. 148 Schematic showing a general electrode layout in a grid. Each of the electrodes can be the current electrodes or the potential electrodes.
The basic DC resistivity (DCR) survey requires a generator that inputs electrical current into the ground and a voltmeter to measure the potential difference between two locations. The basic 4-electrode array is shown in Fig. 147. Various configurations of electrodes are possible.
The current waveform provided by the generator can be harmonic (for a frequency-domain survey), a full-duty bipolar pulse, or a waveform composed of an “on-time” and “off-time”.
Survey configurations
There are many geometries of electrodes that can be used in the field. The electrodes can be co-linear or they can be in an arbitrary configuration. Current and potential electrodes can be on the surface or in boreholes. The choice of which survey geometry to use is governed by: (1) what conductivity structure is sought, (2) field constraints for laying out electrodes, and (3) which equipment is used.
Modern acquisition systems populate an area with electrodes and use different pairs as currents and potential electrodes. Fig. 148 shows a general schematic showing electrode positions on a grid. Since each electrode can be a current or potential electrode, this electrode layout allows for a large set of measurements. It’s generally not feasible, nor desirable, to collect all possible data. Arrays are selected to achieve specific goals. For instance:
Profiling: a fixed array is moved along a line. The data provide information about lateral variations to a depth that is determined by the length of the array.
Sounding: a fixed geometry of electrodes is expanded symetrically about a central point of the array. The data provide information about how the electrical structure varies with depth. The data curve is often called a “sounding” and a single sounding can be inverted to produce a 1D conductivity model. If multiple soundings are available they can be inverted in 2D or 3D. The most common sounding configurations are the Wenner and Schlumberger arrays.
General configuration: These are combinations of profiling and sounding arrays. They are often obtained by defining an electrode array and expanding and translating it along a line. In practice, this is achieved by laying out a line of electrodes, each of which can be used as a current or potential electrode. The most common acquistion arrays are dipole-dipole, pole-dipole, or pole-pole arrays.
Gradient array: This is a reconnaissance array that uses a fixed location for the A and B electrodes which are far apart. Measurements are taken in an area between the current electrodes. Potential differences in orthogonal directions can be acquired but usually only potential differences between electrodes aligned in the same direction as the A and B electrodes are obtained.
Traditionally, data have been collected using co-linear electrodes. Depending upon the relative placement, the geometries have been given specific names. The interactive figure below shows how electrodes are placed for various named arrays. Electrodes placed on lines imply that the array is usually used for profiling. A circle at the array’s center implies that the array is generally expanded symmetrically about its center for acquiring sounding data.
Table 1 : Common DC resistivity arrays (double-click)
Common DC resistivity arrays
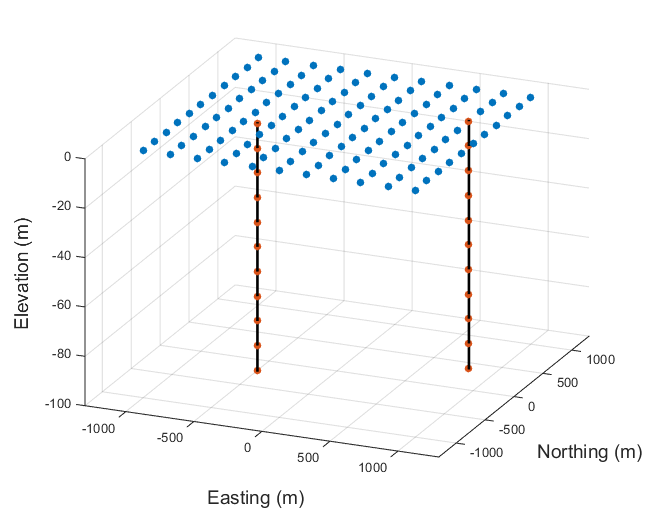
Fig. 149 Electrodes can be placed at the surface or along boreholes.
Three dimensional data acquisition
The general DCR problem can be stated as follows: Given a volume of the earth, collect DCR data and invert them to generate a 3D conductivity model. With modern technologies, data can be collected in three dimensions, using electrodes on the surface and in boreholes (Fig. 149). Any datum from a specific electrode placement produces some information but, as aquistion continues, some electrode placements may not provide new independent information.
Here we outline some basic principles about survey design and provide some acquistion strategies that are currently used.
Some basic principles for designing DCR Surveys
Excite the target of interest: This requires positioning source electrodes so that significant current flows through the target. This sets up the electrical charge distribution.
Measure a signal: The potential electrodes must be close enough to the electrical charges, and configured so that they can measure a potential difference that is above the noise level.
Some general rules
For co-linear arrays, the depth of penetration depends upon the size of the array. The depth to which significant current flows depends upon the distance between the source electrodes. A target at depth can be excited only when the current electrodes are significantly farther apart than the depth of the target. Since a datum is a potential difference, and since deeper targets are associated with smaller electrical charges (there’s only small currents going through), detecting meaningful signal requires that the potential electrodes have significant separation.
Assembling the above information leads to a general statement that depth of penetration progressively decreases as one proceeds from pole-pole, pole- dipole, to dipole-dipole. This is a reasonable rule of thumb and is applicable for surface arrays or for colinear arrays in borehole measurements.
Some 3D Designs
Some common 3D acquistion geometries are outlined below:
Multiple lines of co-linear acquisition, or offset acquistion: An example of a multiple line co-linear survey is shown in Fig. 150. Off- line profiling involves moving the current electrodes along one survey line and recording potentials using electrodes planted along a different (usually parallel) line, as shown in Fig. 151
E-Scan: The E-Scan technique (Fig. 152) is a pole-pole configuration. However, it is organized by planting a large number of electrodes over the area of interest, without trying to stay on grid lines. One potential and one current electrode are placed at “infinity”. When any electrode in the array is used as a current electrode, potentials at all other electrodes are measured. Each electrode, in turn, is used as a current.
Cross-well survey: A cross-well survey is deployed in boreholes, usually using a minimum of 2 wells. Electrodes are positioned along the well and each can be a current or potential electrode. Current electrodes can be in the same well (along-well survey) or in different wells (cross-well survey). An example is shown in Fig. 153. For either current configuration, potentials can be measured in the same well or across wells.
Underground survey: DC resistivity surveys can also be conducted underground, such as in tunnels (Fig. 154). This restricts the survey configurations to be along the tunnel walls and ceilings but these geometries can still provide information about deep targets that may not be detectable from the surface.
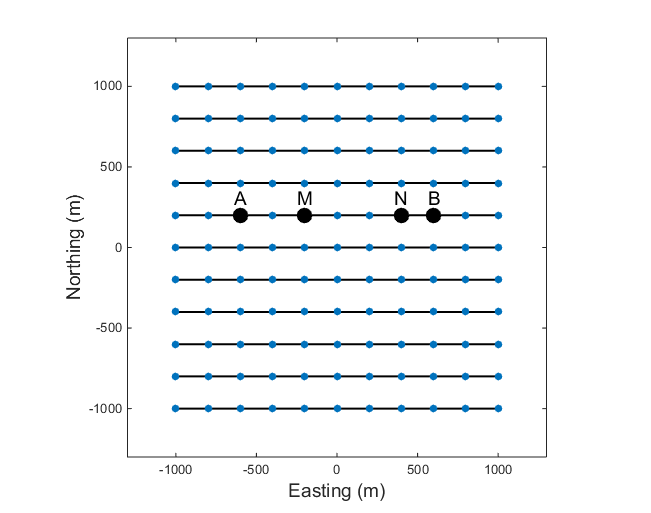
Fig. 150 An example of a co-linear survey with multiple lines. |
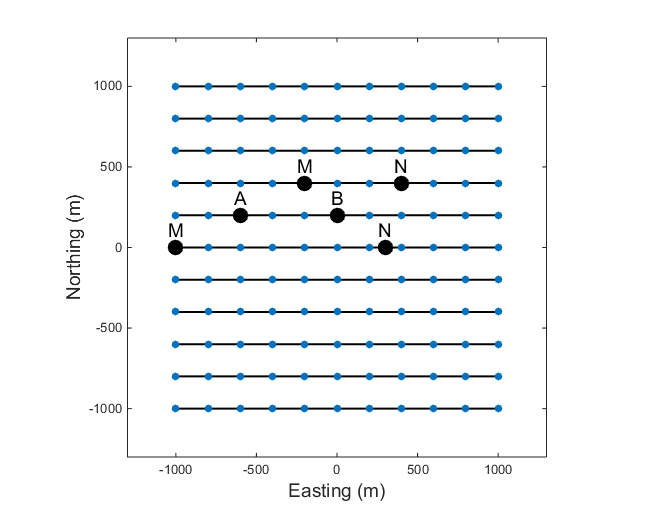
Fig. 151 An example of an offset acquisition survey in 3D. The potential electrodes are on a different line than the current electrodes, as shown for two sets of MN electrodes. |
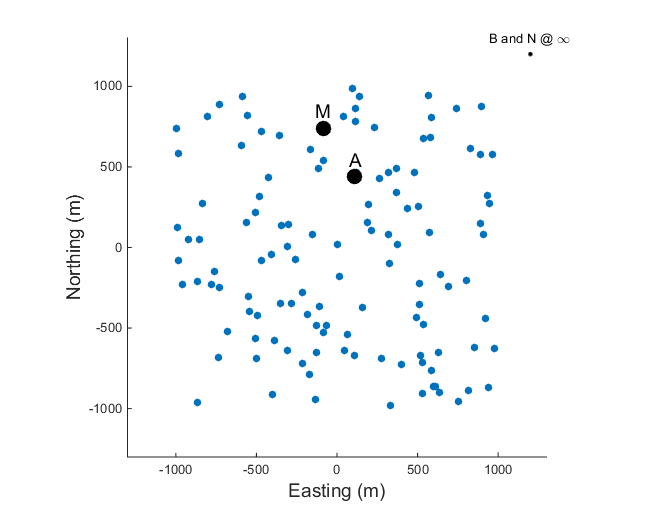
Fig. 152 An example of an E-Scan survey, which uses a pole-pole configuration in a non-grid format. |
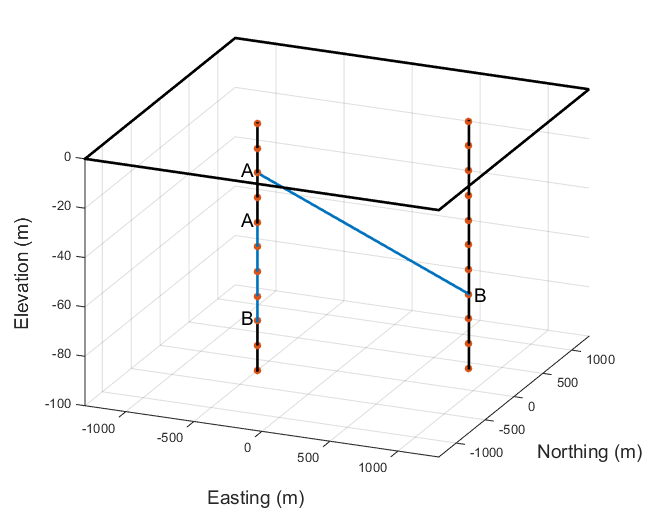
Fig. 153 A cross-well survey has electrodes in boreholes and each electrode can be either a current or potential electrode. The figure shows an example of an along-well transmitter, where A and B are in the same well, and a cross-well transmitter, where A and B are in different wells. |
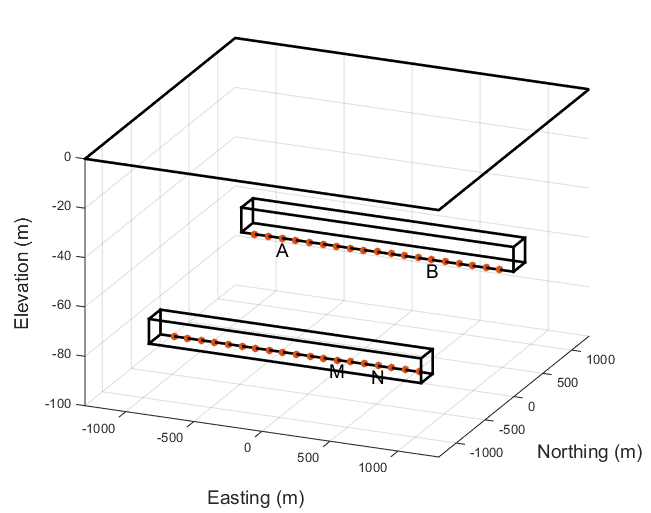
Fig. 154 DC resistivity surveys can also be conducted underground, in a tunnel environment. The tunnel restricts where the electrodes can be placed but any of the above mentioned surveys can be collected. The figure shows an example where the current electrode and potential electrodes are in different tunnels. |
Instrumentation
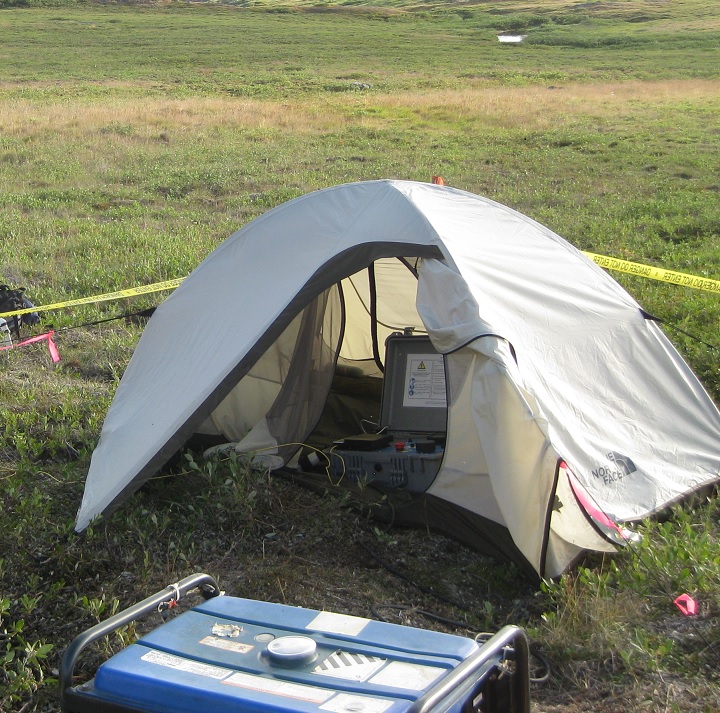
Fig. 155 A typical generator hooked up to a transmitter in the field. (Photo: Micahel McMillan)
The following section provides some information about the instrumentation used in DC resistivity surveys and what’s required for successful data collection. The instrumentation consists of transmitters, receivers, electrodes, and cables. The specific capabilities of these elements will vary depending upon intended use. In the material below we provide specifications that are relevant for a mid-sized mineral exploration project.
Transmitters: A generator or battery provides a source of power for the transmitter in geophysical surveys. A typical example of a generator used for a DC survey would have a power limit of 7500W or greater. For larger scale work, it is possible to obtain transmitters that can source up to 30,000 watts. The transmitter sends out a desired current waveform through the current wire. The electric current and voltage are measured and regulated by the transmitter controller, and either quantity can be set to a particular amount within the power limit. An example of a generator hooked up to a transmitter in the field is shown in Fig. 155 below.
A typical time-domain waveform for DC resistivity is a two second on, two second off, half-duty waveform as shown in Fig. 156. The name comes from the fact that the current is only running for half of the time. The figure shows that the current waveform has a two second positive on-time followed by a two- second off-time, followed by a two-second negative on-time before a final two second off-time (0.125 Hz).
This waveform for the current source is necessary because a voltage measurement, when the current is off, will be non-zero in many situations. Naturally occuring potentials are called spontaneous or self potentials (SP), and they are usually caused by electrochemical activity in the ground or fields that arise from natural atmospheric or ionospheric sources. From the point of view of DC resistivity surveys, SP voltages are noise. The SP signals can be removed by using a bipolar waveform with a 50% duty cycle. Subtracting the responses of the two half-periods removes the SP provided that the SP signal doesn’t vary significantly during one period of the waveform.
Fig. 156 A typical transmitter waveform with a 50% duty cycle. When no chargeable material is present (i.e., no IP effects), the voltage curve mimics the shape of the current waveform.
Receivers: Two receiver electrodes are used to measure the voltage difference in a DC survey. For DC resisitivity sounding, a simple digital volt meter can be adequate. A more complex system may involve amplifiers, filters, transmitter synchronizing circuits, display, storage, many inputs for simultaneous recording of many potentials, and other features.
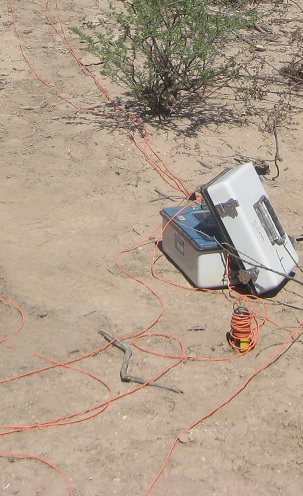
Fig. 157 A single porous pot electrode in the ground connected to a receiver. (Photo: Michael McMillan)
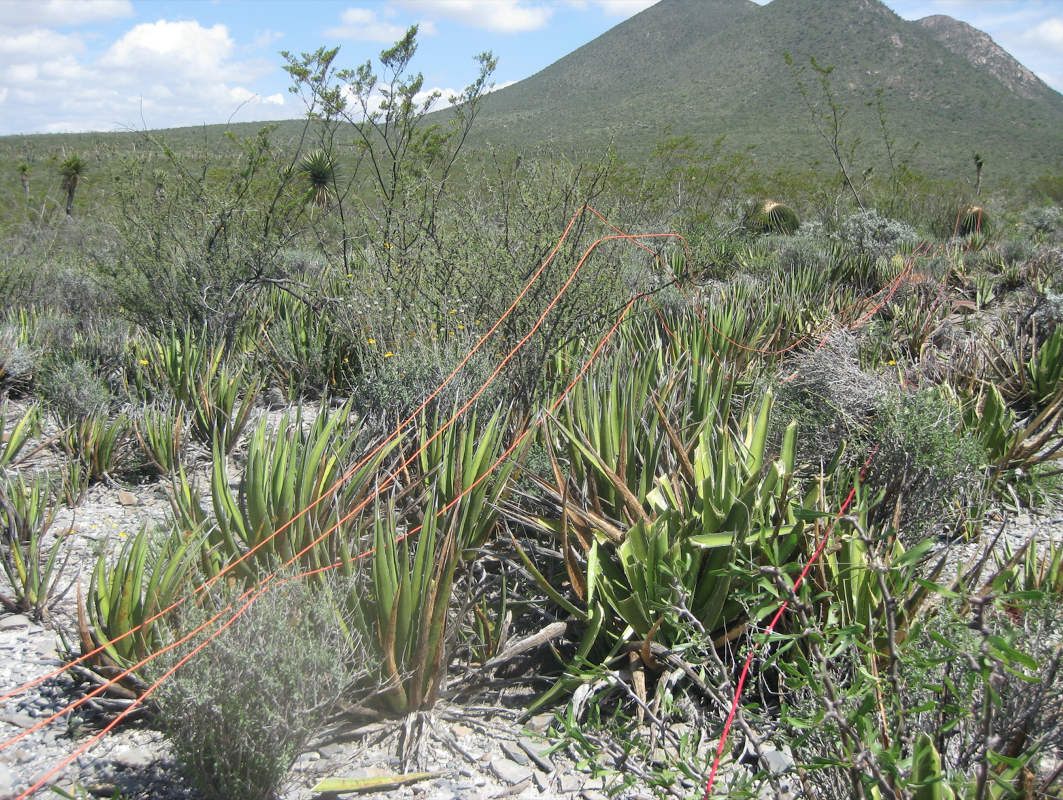
Fig. 158 Red current wire (12-gauge) with multiple receiver wires (16-gauge) in orange. (Photo: Michael McMillan)
Electrodes: In general, current injection and potential measurement electrodes are not interchangeable. However, automated acquisition systems using smaller source currents often employ the same stainless steel electrodes for a current electrode and a potential electrode. This becomes more difficult as the source current increases in strength because the ground can become altered by high current densities and the electrode can become polarized.
Current electrodes transmit electricity into the ground, and as such they need good contact with the ground, i.e., low impedance or small contact resistance. Stainless steel stakes, sheets of foil, and wetted ground are all possible approaches to improving contact resistance. Pouring salty water on the electrodes can help to improve the contact, or the electrode can be wrapped with a soaked cloth.
For measuring potentials, low noise, non-polarizing (not necessarily low impedance) electrodes are sought after. Small lead plates buried in the soil will often help achieve this. In more difficult situations, wet electrodes made from porous ceramic jars containing salt solutions are required. It is also common to use lead wire in a lead-chloride mix or copper wire in a copper-sulphate solution. This eliminates self potential between the wire and the ground and improves the quality of the data. An example of a porous pot receiver electrode for a DC survey with a copper sulphate solution is shown in Fig. 157.
Capacitive sensors are different from electrodes in that they don’t require a galvanic contact with the earth. These sensors allow measurement of the electric field by placing a unit on the surface. Good contact with the ground is not required and this allows reliable data to be collected in regions with dry soils or icy conditions and other areas where electrode emplacement is difficult.
Cables: For small scale work, some systems are available that use multi-conductor cable, and possible “smart” electrodes that can be switched between input and measurement functions by computer. For large scale work, this is not practical because of the large currents involved (up to a hundred Amps or so in some cases). Multi-conductor cables with individual wires capable of carrying that current would be prohibitively heavy for mineral exploration surveys, which commonly involve profile lines several kilometers long. However, there are some systems that use multi-conductor seismic cables for the potentials while requiring the normal single, heavy gauge wire for the current source. A typical 12-gauge current wire (red) used for a DC survey is shown in Fig. 158 along with 16-gauge receiver wires (orange).