Surveys
Our first attempts to image the Furggwanghorn rock glacier involved acquiring surfaced-based GPR data using two different acquisition systems and three different antennae (second to fourth columns in Table 3 and Fig. 411 a - c). GPR data were recorded along multiple lines during the Winter / Spring of 2010, 2011 and 2012 and during the Summer of 2012. See the caption to Fig. 412 for the locations of three of these lines (G1 - G3).
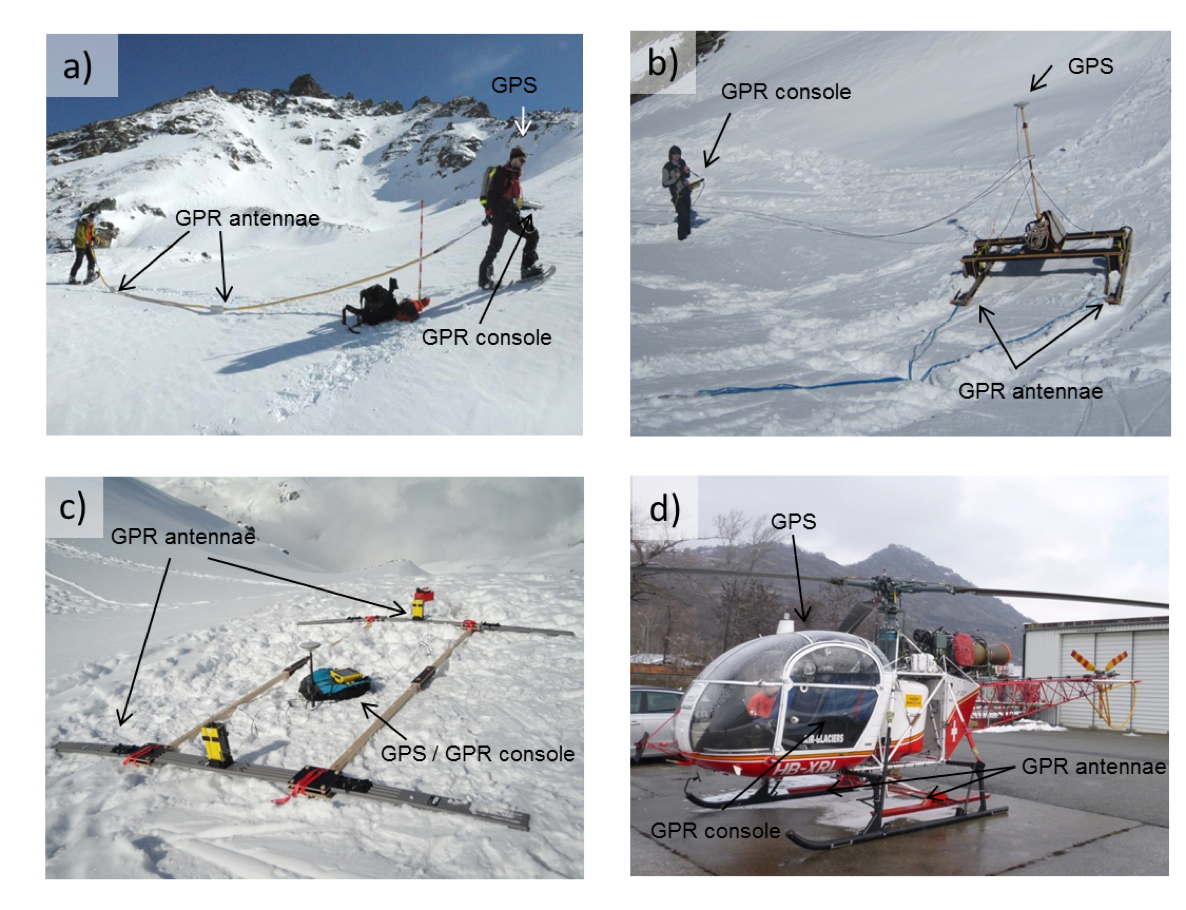
Fig. 411 Winter/Spring deployment of different GPR systems: (a) 50 MHz Mala Rough Terrain Antennae, (b) Sled mounted 50 MHz pulseEKKO PRO, (c) rigid frame mounted 25 MHz pulseEKKO PRO and (d) helicopter mounted 60 MHz GSSI SIR-3000.
Table 3: Data acquisition systems used for surface-based GPR surveying the Furggwanghorn rock glacier.
Division |
Ground |
Ground |
Ground |
Helicopter |
|---|---|---|---|---|
System
|
pulseEKKO PRO |
pulseEKKO PRO |
Mala RTA |
GSSI SIR-3000 |
Nominal Antennae frequency (MHz)
|
50 |
25 |
50 |
60 |
Antenna separation (m)
|
2 |
4 |
4 |
2 |
Antenna configuration
|
Parallel-broadside |
Perpendicular-broadside |
Parallel-endfire |
Parallel-broadside |
Sampling rate (ns)
|
1.6 |
3.2 |
1.46 |
1.46 |
Trace length (ns)
|
2000 |
5040 |
1547 |
3000 |
Antenna transportation
|
Sled |
Rigid frame |
Snake antennae |
Helicopter |
Positioning
|
Diff. GPS |
Diff. GPS |
Diff. GPS |
Diff. GPS |
After obtaining disappointing results from the surface-based GPR surveys, a few lines of H-GPR data were recorded in the Winter / Spring of 2012. The high quality of the 2012 H-GPR images prompted the full 3D GPR survey during the Winter / Spring of 2013. A total of ~9000 m of H-GPR data were acquired 15 ‑ 20 m above ground along sixteen ~450 m long east-west lines separated by an average of ~10 m and along four ~340 m long north-south lines (Fig. 412). In addition to crossing the active rock glacier (ARG in Fig. 409), the lines traversed parts of the rock glacier’s root zone (RGRZ), inactive and relict rock glaciers (IRG and RRG), the talus, and several bedrock outcrops.
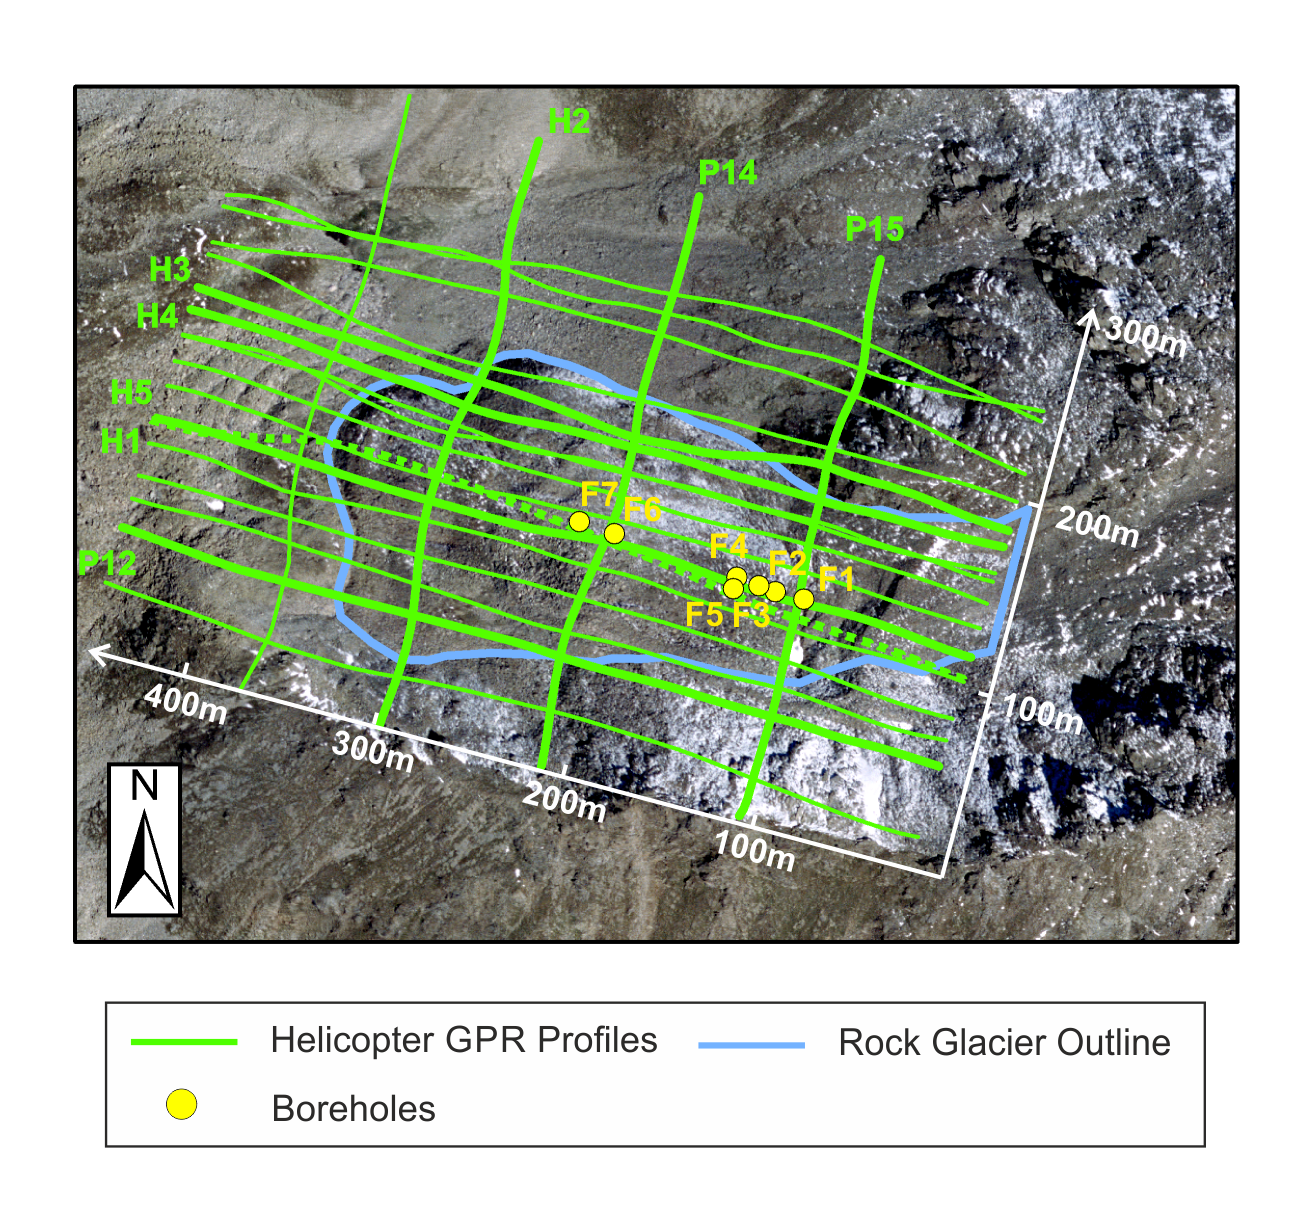
Fig. 412 Locations of H-GPR lines (green lines) acquired during the Winter / Spring of 2012 and 2013 and boreholes (yellow dots). The surface-based GPR sections G1 - G3 presented in Fig. 414 were recorded in the vicinity of boreholes F4 ‑ F7 close to and subparallel to H-GPR profiles H1 and H5.