Interpretation
The general consistency of the H-GPR sections and some of the large scale features of the Furggwanghorn rock glacier and adjacent and underlying geological units are best viewed by progressively moving through the 3D volume of images in the following animation.
Animation 1. 3D representation of the H-GPR images.
Structural Details
To interpret the subsurface structure of the Furggwanghorn rock glacier required iterative analyses of each H‑GPR image constrained by surface knowledge, information contained in adjacent and crossing images and the results of geological and geotechnical studies of seven 25 m deep boreholes that extended along the central axis of the rock glacier (Fig. 412). Typical examples of noninterpreted and interpreted migrated helicopter GPR images are presented in Fig. 418 and Fig. 419. The H-GPR images are characterized by the following GPR reflection facies that are consistent on multiple neighboring and crossing H-GPR images:
facies 1: subhorizontal layered reflections,
facies 2: layered reflections with a predominant dip,
facies 3: sigmoidal shaped reflections,
facies 4: curvilinear reflections,
facies 5: chaotically oriented reflections,
facies 6: low reflectivity.
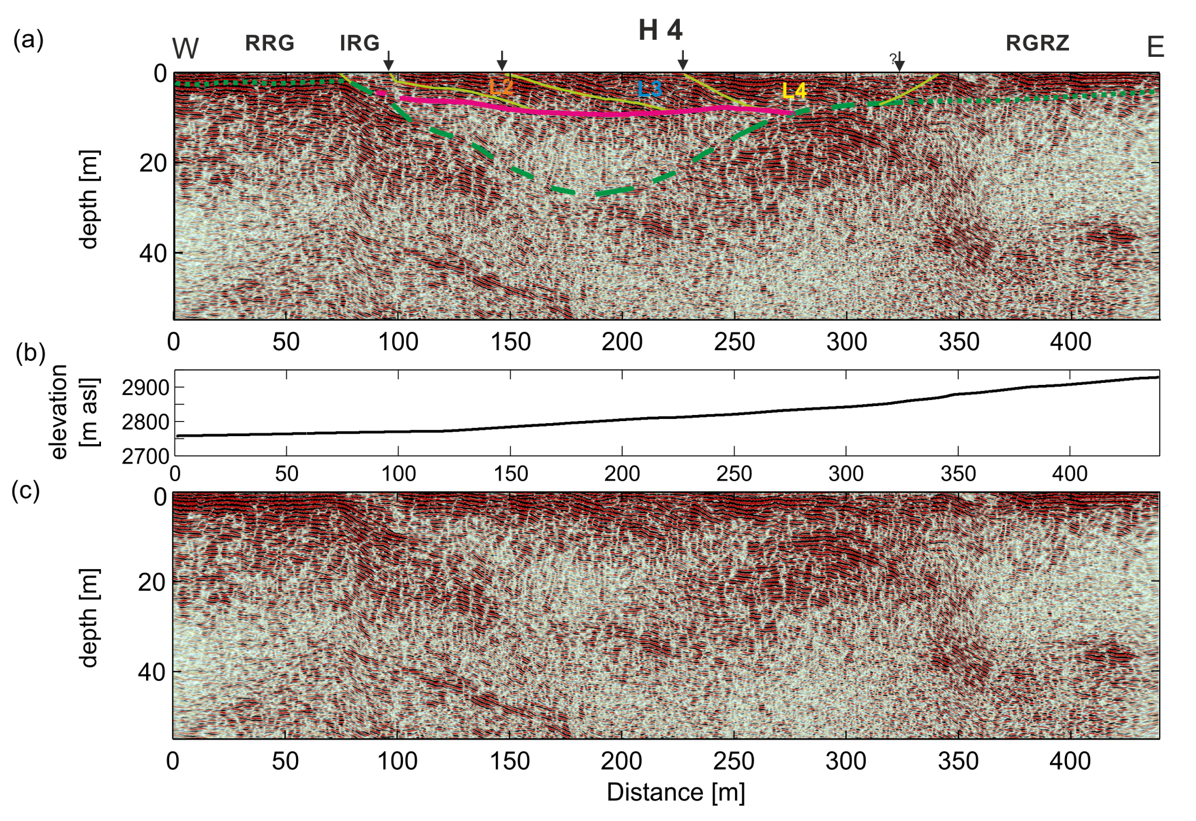
Fig. 418 Interpreted image for H-GPR line H4 (a). Dashed and dotted dark green lines: bedrock surface. Magenta line: major shear zone between the ice- rich highly reflective region and the ice-poor weakly reflective region. Light green lines: fault zone boundaries of rock glacier lobes. RGRZ: rock glacier root zone. L2, L3 and L4: active rock glacier lobes. IRG: inactive rock glacier. RRG: relict rock glacier. Thick black arrows: surface locations of lobe boundaries delineated by transverse ridges. V : H ≈ 1: 1. (b) Topography. (c) Noninterpreted H-GPR image.
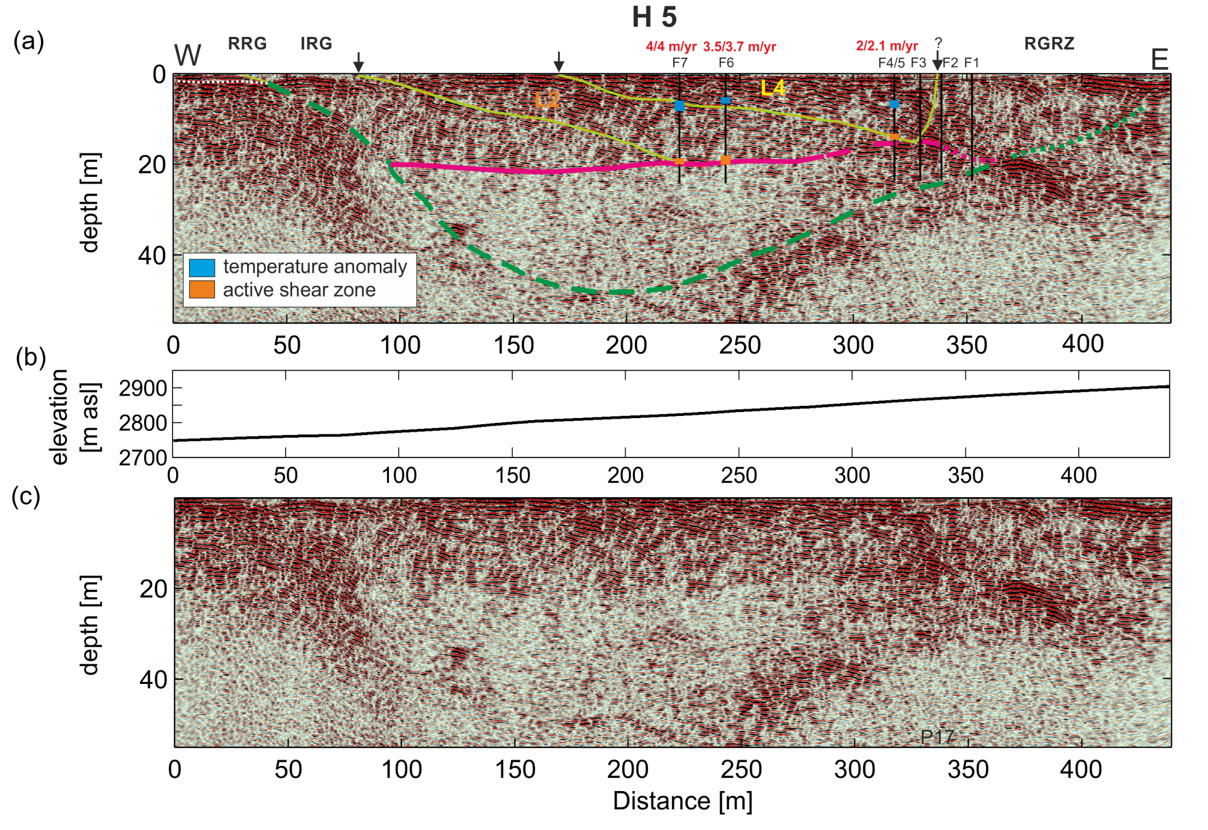
Fig. 419 As in Figure 12 but for H-GPR image and topography along line H5. Active and currently inactive fault zones in boreholes F5, F6, and F7 are defined by temperature anomalies and/or displacements. Red numbers: annual displacement at the surface / annual displacement across the major shear zone according to inclinometer measurements.
The various GPR facies have allowed distinct geological units to be identified. Boundaries of these geological units are delineated by prominent reflections, abrupt truncations of reflection packages and/or changes in GPR facies. These boundaries represent fault zones or unconformities.
An upper high reflectivity region characterized by reflection facies 1 - 3 is observed across most of the Furggwanghorn rock glacier. This high reflectivity region extends from the surface to 9 ‑ 21 m depths. It is underlain by an extensive region of reflection facies 6. The interface between the high and low reflectivity regions (magenta lines in Fig. 418 and Fig. 419) is gradational at some locations and sharp at others. Geological and geotechnical borehole information [BMZ+13] demonstrates that the high and low reflectivity regions are ice rich and ice poor, respectively, and that the interface between the two regions is an active major shear zone. Movements across this major shear zone have average rates of 2.1, 3.7, and 4.0 m/yr in boreholes F5, F6, and F7 (Fig. 419). No significant movements have been detected beneath the major shear zone.
Four geological units, each dominated by a single GPR reflection facies, are observed within the upper high reflectivity region (Fig. 418 and Fig. 419). From their 3D reflection character, we interpret the boundaries of these geological units as fault zones. The geological units correspond at the surface to the four topographically defined rock glacier lobes L1 ‑ L4 in Fig. 409. The interpreted fault zones appear to merge downwards with the major shear zone in a listric fashion and project upwards to the topographic ridges that define the borders of the lobes. Small temperature anomalies are observed at one of the listric fault zones in two boreholes (Fig. 419). Marked increases in reflectivity below the low reflectivity region are interpreted as the bedrock (Fig. 418 and Fig. 419) based on the intersection of bedrock in borehole F1 and the high reflectivity of bedrock outcrops and shallow bedrock occurrences that are crossed by the H-GPR lines. Reflection facies 1 - 6 are observed at various locations within the bedrock.
3D Geometry of the Bedrock Surface, major Shear Zone and Rock Glacier Lobes
Fig. 420 shows perspective views of the bedrock surface, major shear zone (décollement) and four rock glacier lobes as determined from the H-GPR images. The Furggwanghorn rock glacier is located within a pronounced bedrock trough that reaches a ~48 m depth (Fig. 420 a). Rock glacier lobe L4 overlies parts of the other lobes in the H-GPR images, suggesting it is the youngest. Similarly, L3 is likely younger than L2. Because L4 is the only lobe to overlap with L1, the age of L1 relative to L2 and L3 is not established. Nevertheless, except for the timing of the major shear zone, the sequence of images presented in Fig. 420 and the following animation are plausible representations of the rock glacier’s evolution.
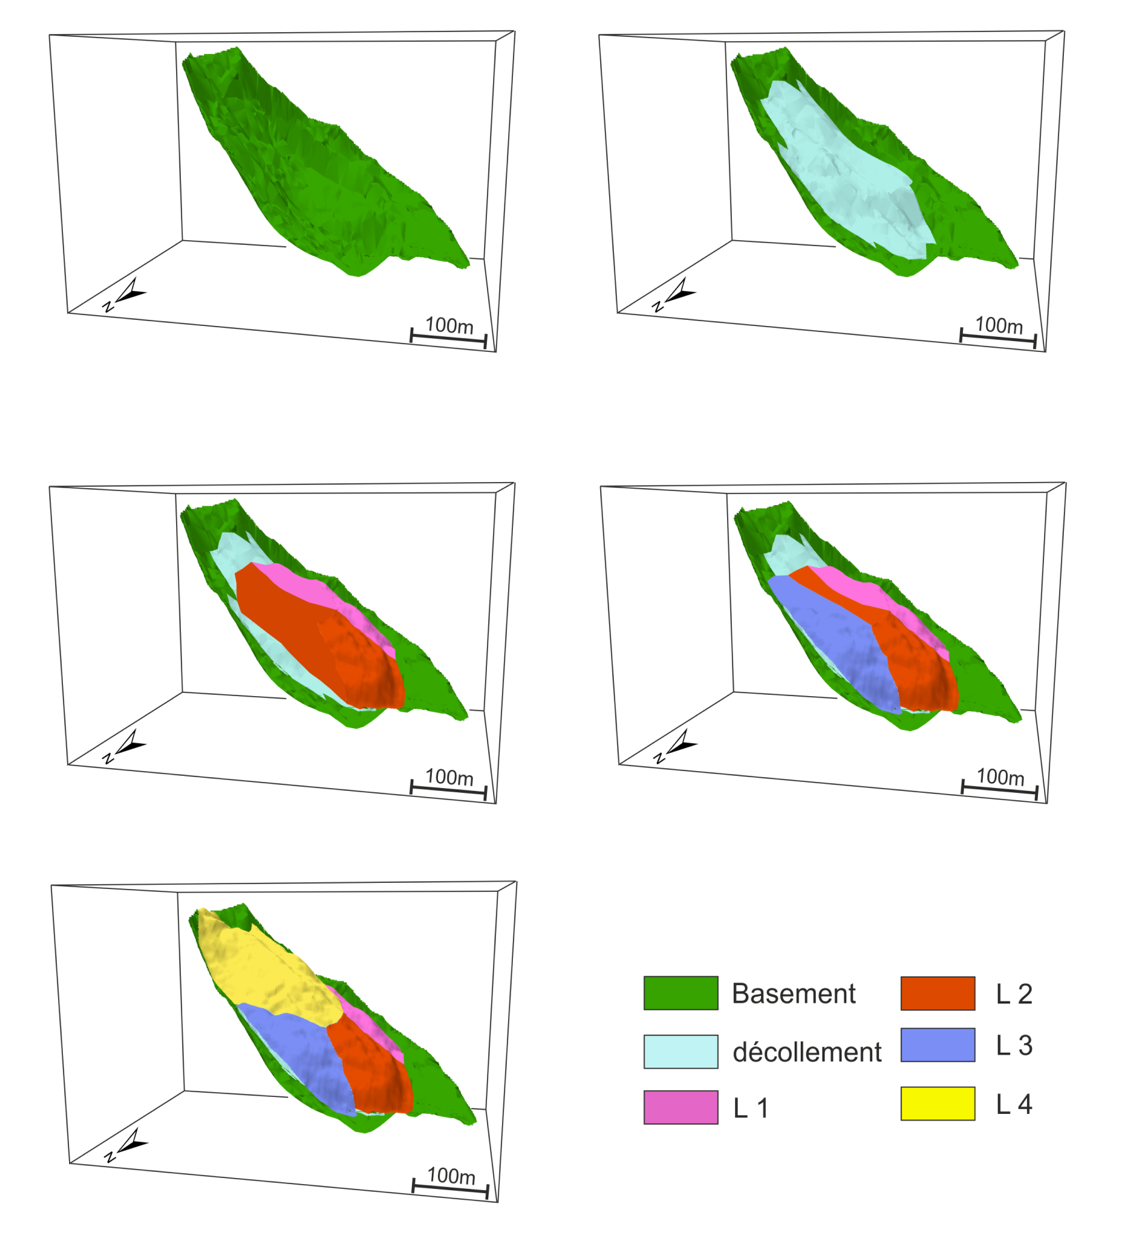
Fig. 420 3D Furggwanghorn rock glacier model. Bedrock is overlain by the major shear zone (décollement) and lobes L1–L4.
Animation 2. Images of bedrock, major shear zone and rock glacier lobes.